
Remember this fancy do-hickey?
It’s the Instance Viewer. We introduced it as a new feature in version 4.1.
For version 4.2, we added this – the Top SQL panel.
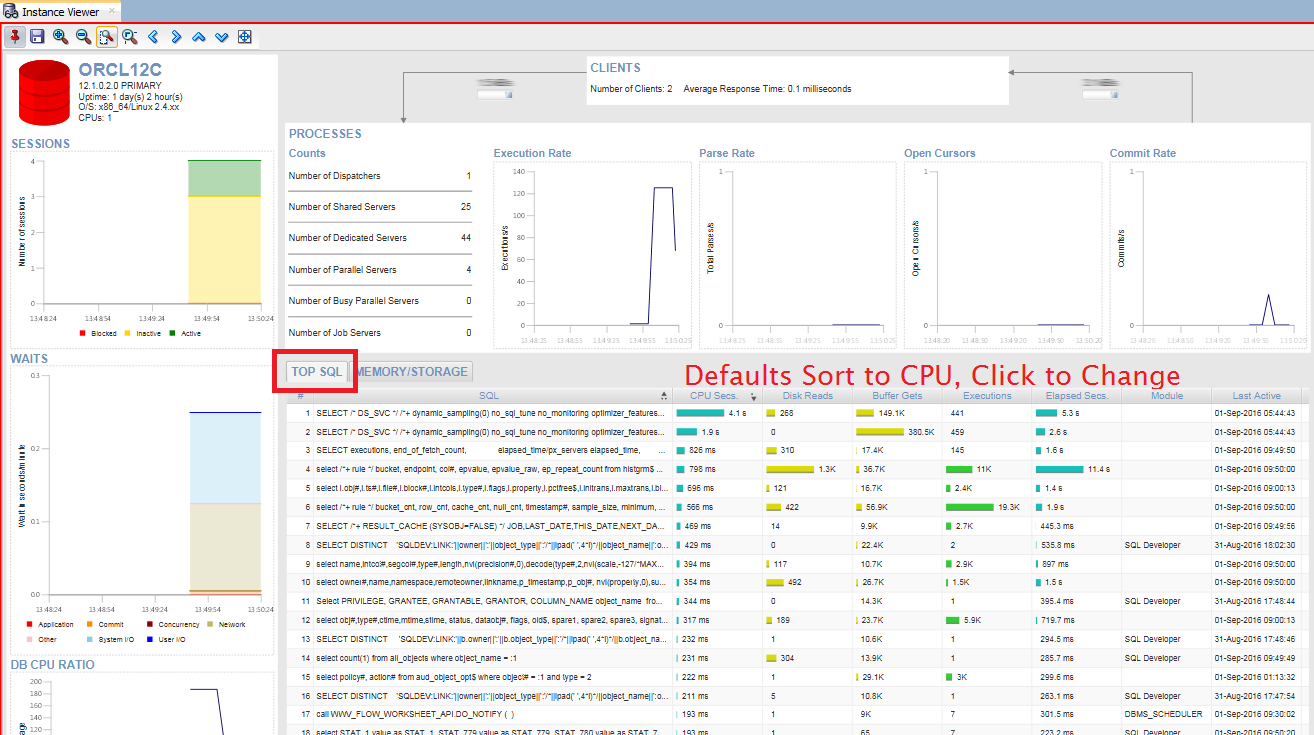
We ask the database every 10 seconds what the most expensive query by CPU is. Maybe that’s a bit too aggressive for you?
What if you only wanted to ask every…10 minutes?
You can do this.
You’ll want the Instance Viewer to be open and running, or the Metrics Console won’t display anything.
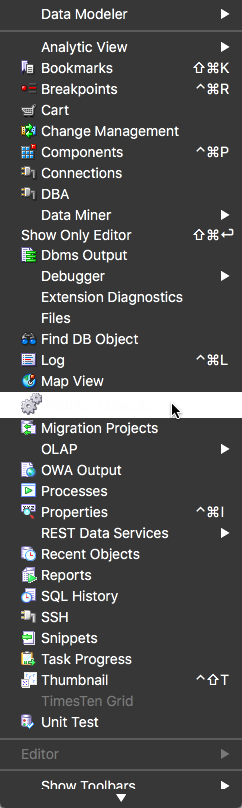
In the panel, select your connection and expand the Tree.
Look for your metric – the Top SQL one is easy to find 🙂
Right click, ‘Edit…’
Select your new time period.
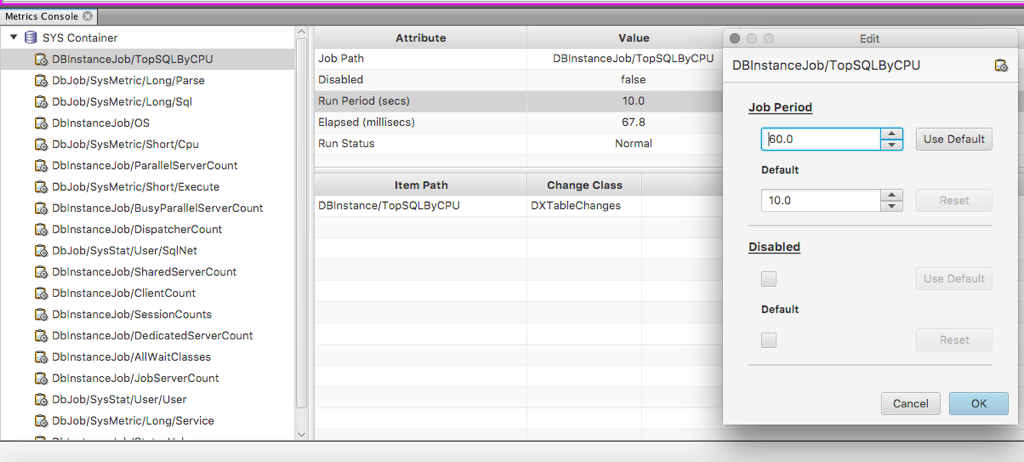
Click ‘Ok’ and you’ll get a confirmation message, and you’re done.
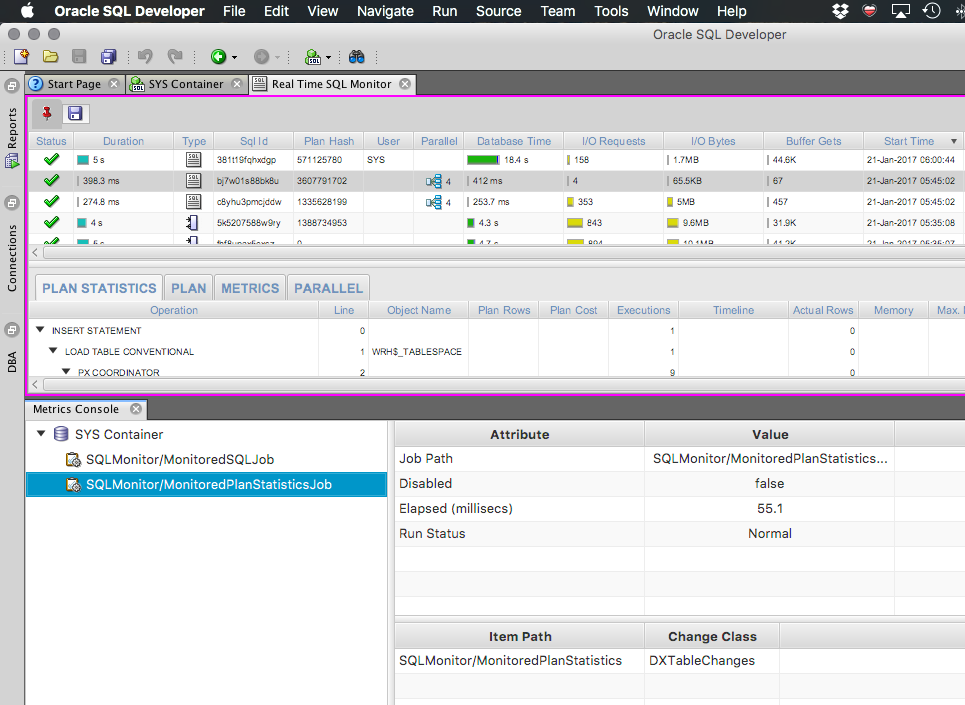
This Is Also Available for Real Time SQL Monitoring
This is a brand new page we built for v4.2.
Maybe you don’t want to be so aggressive on updating the RTSM report details?
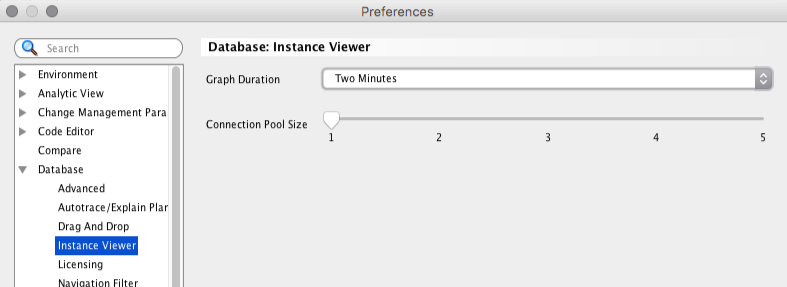
One Last Word on the Instance Viewer
There is another way to configure it.
Maybe you want to see more than the last 30 seconds of activity in the graphs? You could set it up to show the last 2 hours of IO.
Or, maybe you want to split the queries we’re running from one connection to 5 connections?
You can set both of these in the Preferences.


9 Comments
Hi Jeff,
One thing I noticed on the Top SQL window is the sorts default to the opposite of what would be most useful.
For instance when I click on Executions it sorts lowest to highest. So I get a bunch of queries with 0 executions. What I usually worry about is the queries with the MOST executions, so I need to click on the column again.
Same for CPU Secs, DiskReads and most of the other columns.
I’s also not always sure what the column means. Executions since when? When I go to Details for a query the elapsed time / execution history does not match the executions column.
Is this view used somewhere else that I can find documentation for?
Thanks,
Jim
agreed, default sort should be DESC
the metrics are just the current values of the associated v/gv$ views…we hit those every X seconds and display the values on the chart…i think teh default window for the chart itself is a few minutes
if you look at view > Log > statements you can see what we’re firing to populate the charts and reports
Thanks for the new features. The comments I get from the TOADSTERS are that it’s like drinking from a fire hose. Could you drill down into several of the metrics with some examples, why a particular column might be important to developers or DBA’s. If you don’t have time for such a discussion we understand, everyone needs to sleep. Great new feature! Thanks
A column? Not sure what you mean.
Hi Jeff
the Instance Viewer is cool and everything.
But it looks like it is using all of the database resources as it crashes other running applications based on Oracle Forms.
I tried to reduce the refresh interval but with no luck.
I am on Oracle 11.2.04 and SQL-Developer ea 4.2.0.16.260
It does issue a ton of queries, over a short amount of time. And will refresh as you keep the screen open. You can see these go across the JDBC driver in View > Log > Statements.
Maybe your data dictionary stats are stale?
I have reissued the following statements just now and still I am getting the same results.
EXEC DBMS_STATS.GATHER_SCHEMA_STATS (‘SYS’);
exec DBMS_STATS.GATHER_DATABASE_STATS (gather_sys=>TRUE);
EXEC DBMS_STATS.GATHER_DICTIONARY_STATS;
EXEC DBMS_STATS.GATHER_FIXED_OBJECTS_STATS;
After some seconds of activity of the Instance Viewer my Oracle Forms applet is crashing. Never seen something like this before
I’d hate to make another guess and be wrong. Can you elaborate on the nature of your Forms crash? Any error messages?
SQL Developer is just running queries…If you forced me to guess again I’d say temp space or SGA resources are being exhausted.
I tried some more debugging and tracing.
The Instance Viewer is crashing my Firefox Browser running the Oracle Forms Applet only if both programs are running on the same client.
So to me it looks like some Java, Cache, whatsoever problem on the client side.
I am on a vm running Windows 10 with Java 1.8.111 installed.
The Java Console is not showing any errors.