

Updated September 2020
This is going to be a FAQ. I get these questions all the time, and I need a place to send people when I don’t have time to live-demo.
If your question isn’t below, add yours as a comment.
If you want to know what the debugger is or why they might try it over DBMS_OUTPUT, read this.
Or skip all this and just go through the slides and YouTube video
Need more, here you go:
How do I start a debug session?
There are two debugger interfaces, DBMS_DEBUG and the newer, and more powerful Java Debug Wire Protocol (JDWP) version.
SQL Developer has from the beginning, ONLY supported JDWP. However this requires that your database is able to CONNECT back down to YOUR CLIENT to start a debug session.
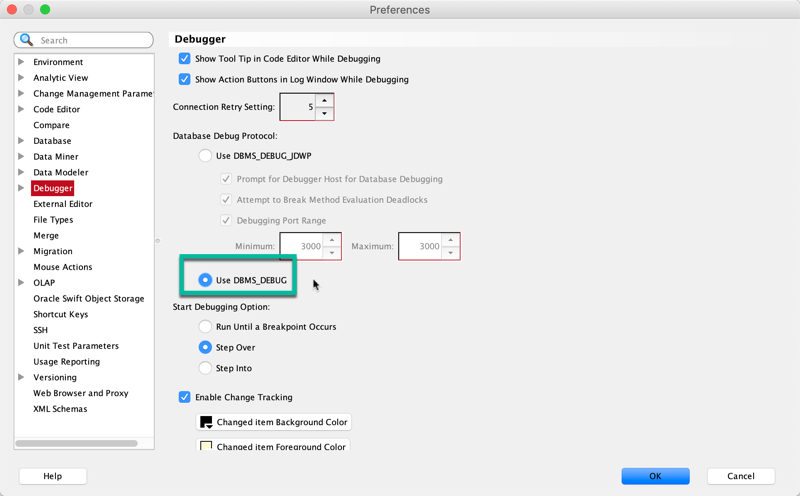
Starting with version 20.2, we now also support the DBMS_DEBUG interface which simply opens a 2nd client based connection to the database for debugging – much simpler, but slightly less feature rich.
Either way, starting a debug session is the same set of steps…
Open your PL/SQL object in our code editor – NOT in a SQL Worksheet. The code editor is the actual IDE that has the cool stuff you need whereas the SQL Worksheet is the ‘dumb’ editor you can run any SQL or PL/SQL through.
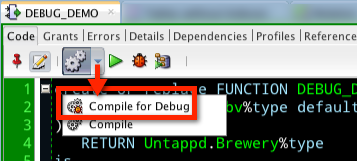
Compile for debug. You CAN skip this step, but if you do, certain things won’t work – like breakpoints.
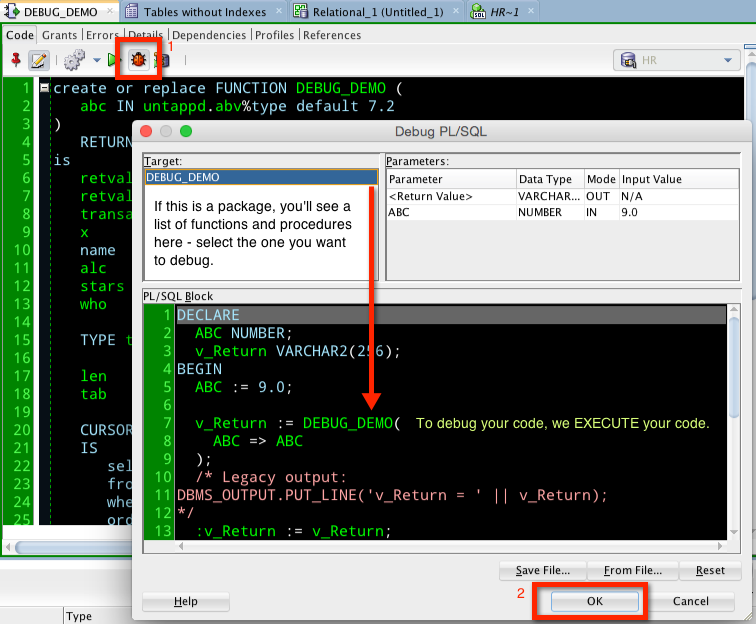
Hit the debug button. Supply any required input parameters and hit OK.
You’re now debugging!
Wait, that didn’t work!
Either you don’t have the required privs to run a debug session OR the firewall is getting in the way OR you’re in Database 12c and you haven’t setup the Access Control List (ACL.)
Privs
- Execute on the procedure – remember, debugging a proc means you’re EXECUTING the proc
- DEBUG CONNECT SESSION
- and maybe DEBUG ANY PROCEDURE
Firewall
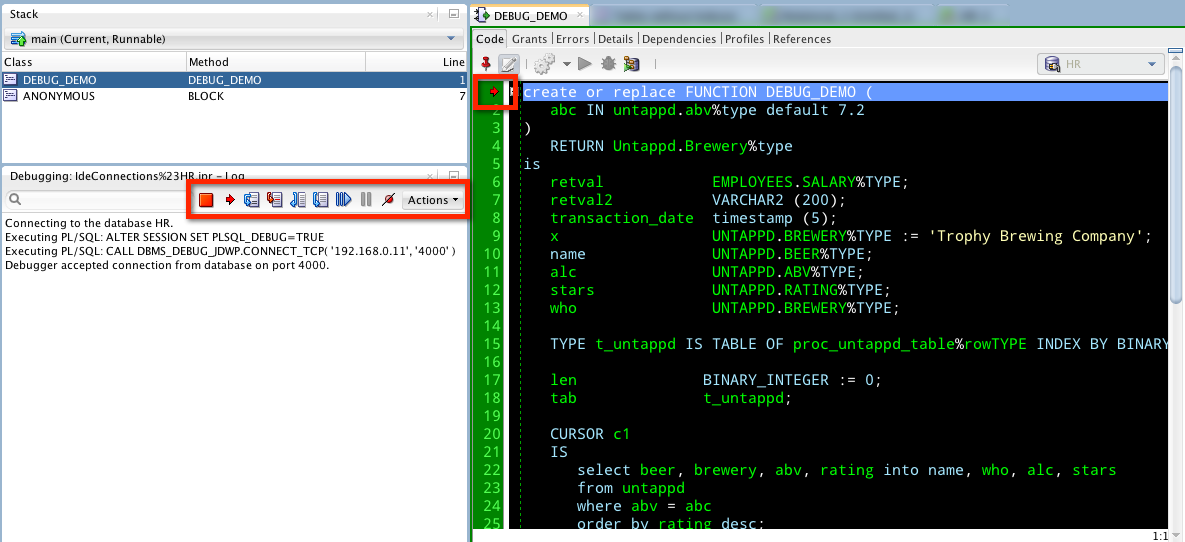
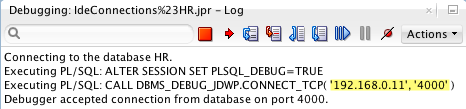
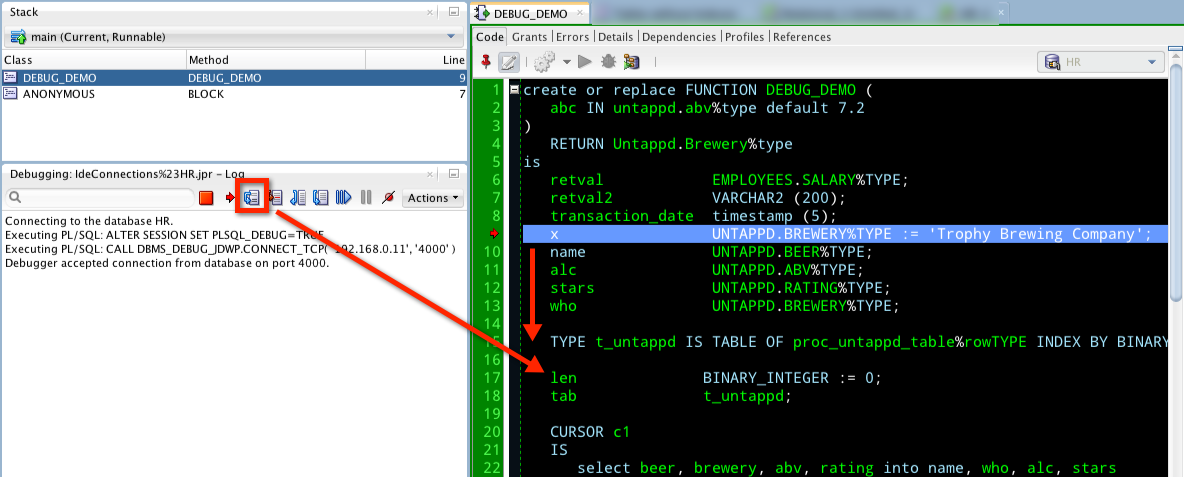
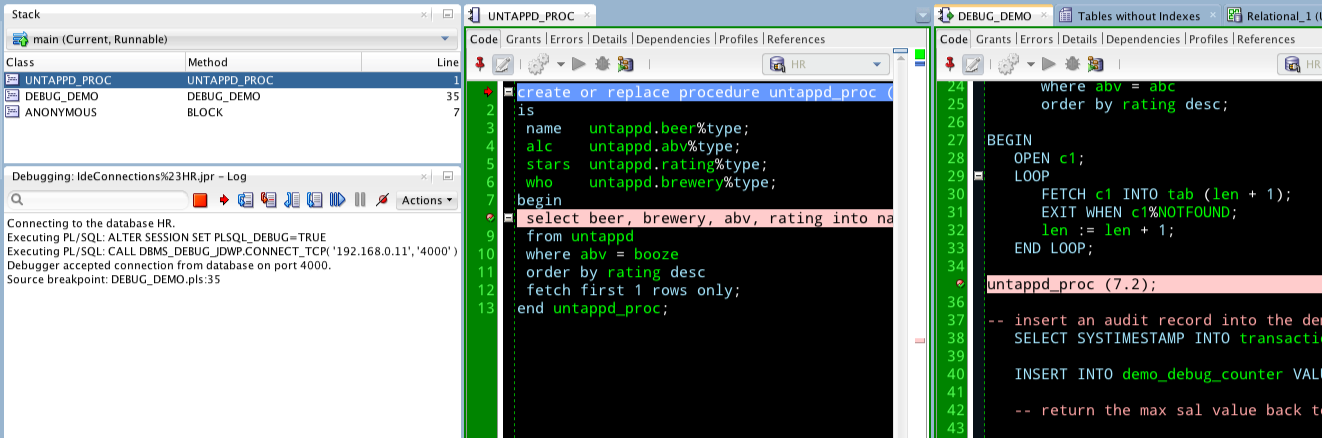
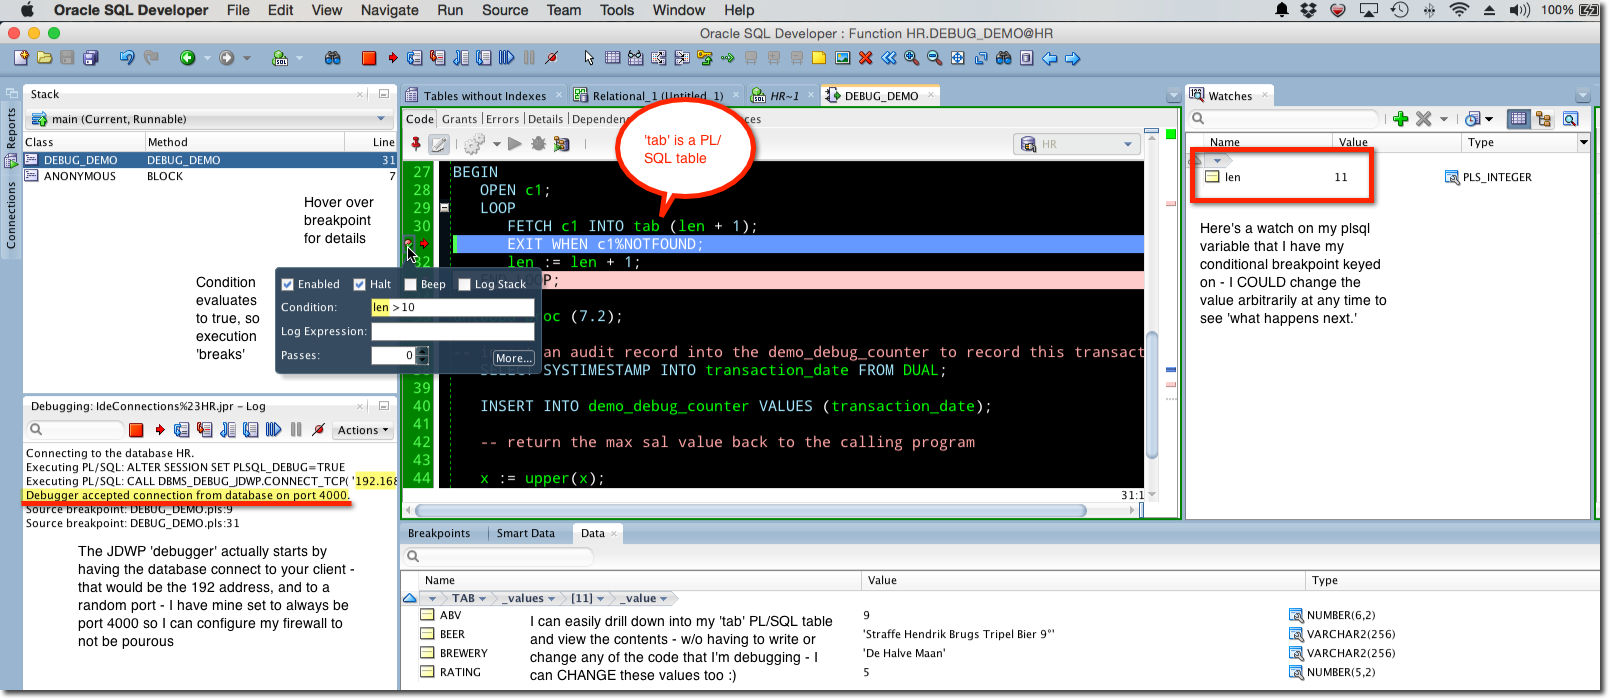
When we start a debug session, the debugger is actually running on your client machine. The database reaches out to your machine. That’s right, it’s Server -> Client NOT Client -> Server.
You can see this in the debug panel.
So, if you’re a developer and want to use our debugger, you need to work with your DBA or network admins to open up the firewall such that your database server can make it to your client.
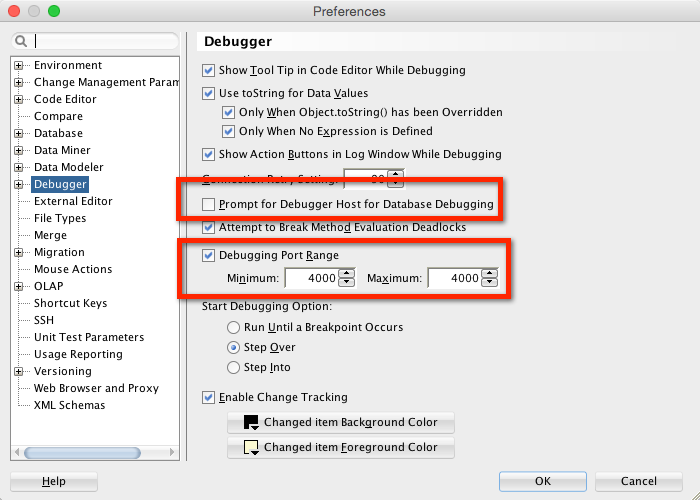
You can do a couple of things to make this easier. You can have SQL Developer prompt you for the network name/address to use and you can define the port range you want to use.
ACL
In Database 12c there is a new security protocol in place that prevents the database from just reaching out to things on the network [DOCS]. You have to set it up such that it can make a JDWP call, to a place or range of places on the network, and for your database user account.
My co-worker Colm Divily wrote a great blog on this – and it goes into great depth on how to get your VirtualBox networking options correct if you’re running SQL Developer on your host and debugging a database running in a virtual machine.
Update for 20.2 DBMS_DEBUG
The stuff up above about ACL, that’s the tricksy part of the JDWP interface – you’re likely going to require DBA (if not also a network engineer) to intercede on your behalf to set it up.
Skip that, go straight to DBMS_DEBUG
I tried to debug, but nothing happened.
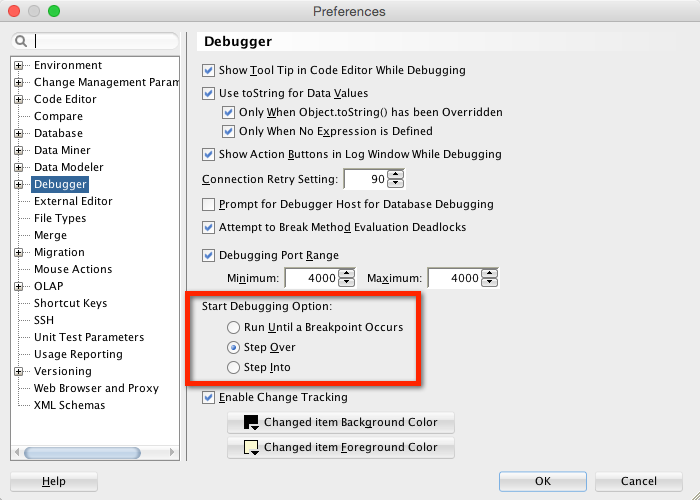
By default the debugger is set to run until it hits a breakpoint. If you don’t have a breakpoint set, it will just run your program.
I have my copy of SQLDev set to debug and not do anything until I tell it to. That way if I forget to set a breakpoint, no problem.
Ok, I’m debugging, now what?
Step through your code, see what’s happening.
You can also say ‘Step Into.’
Which will do exactly what ‘Step Over’ does unless:
But I want to SEE STUFF too!
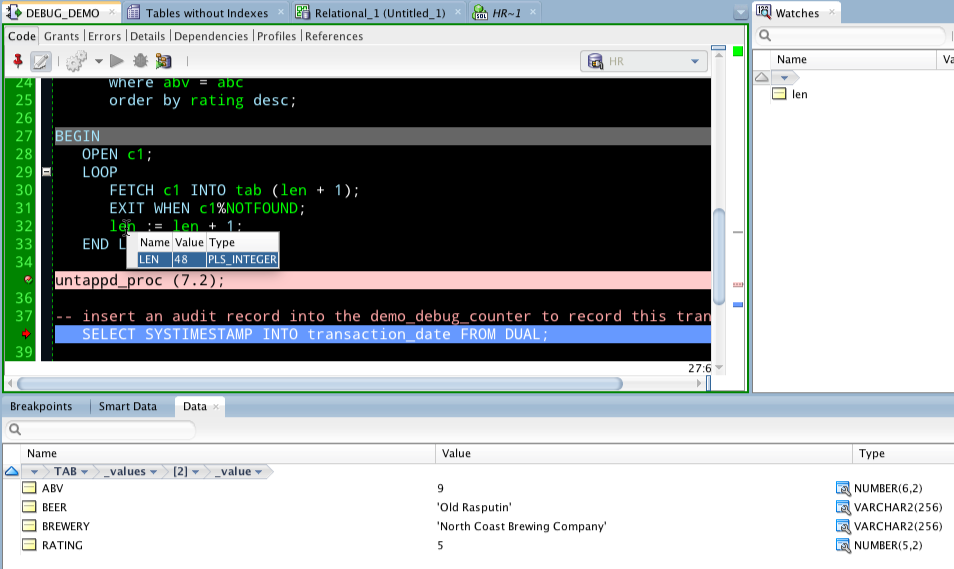
If the watches aren’t working, you probably didn’t compile for debug.
I wrote this post that goes over the data, smart data, and watches panels in more detail.
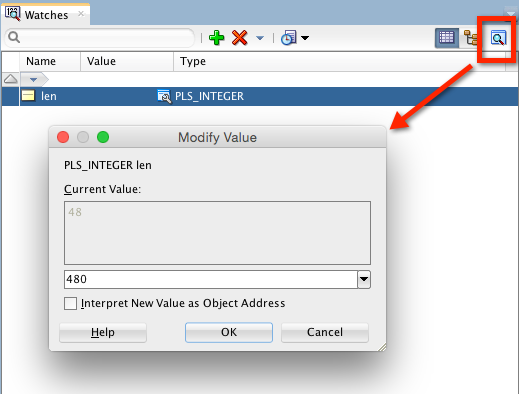
I want to CHANGE stuff!
This is where it gets cool, really cool. Instead of changing your code to make a scenario happen, you can edit the value of a variable in the debug session to force it.
All of this stepping takes too much time!
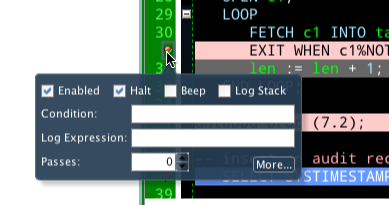
Agreed. Use breakpoints.
Click in the gutter to add a breakpoint. Hit execute or resume. The debugger will run until it hits your breakpoint – assuming that either the breakpoint is on an executable line AND that your breakpoint doesn’t have a pass count or condition attached to it.
I should have said this post would be mostly everything.
I’ve already made the post too long, but if you want to know more, ask away!
I’ll end the post with one last screenshot – it shows how I have my desktop setup in SQLDev when I’m debugging. You have a ton of flexibility as to what you want open, what to be displayed, and where.


27 Comments
How can one open/view the stack window when debugging in SQL Developer 19.2?
This link seems to describe how to do it: https://download.oracle.com/otn_hosted_doc/jdeveloper/101301/java_app_dev/debug/deb_astackwindow.html
However, the View menu never offers a “Debug Windows” selection…
Try Window-Reset to Factory Settings
Jeff — thanks…Window-Reset to Factory Settings restored the window…
Just for fun, I closed it again – – and now can’t get it back without running
Window-Reset to Factory Settings again…is there a way to gain full control of the stack pane?
Stop closing it 🙂
Just noticed SQL Developer 20.2 is out — same issue with the stack pane…
I am confused about DBMS_DEBUG being in the SQL Developer preferences now (as of 20.2). Wasn’t DBMS_DEBUG deprecated after 12c, or is that some older version of DBMS_DEBUG? When I tried DBMS_DEBUG in SQL Developer 20.4 it took much longer to start than using DBMS_DEBUG_JDWP, and when I removed the ACL I added for JDWP to work, using DBMS_DEBUG locked up my session of SQL Developer when I started debugging. So, I am sticking with DBMS_DEBUG_JDWP for now.
Can you elaborate on the status, performance, and future of DBMS_DEBUG vs DBMS_DEBUG_JDWP?
There was talk of deprecating it, but it never came to fruition.
It’ll take as long as it takes to make any database connection.
It’s less powerful than jdwp, but it’s good enough for most people.
There’s no connection between your ACL and dbms_debug.
Using DBMS_DEBUG instead of DBMS_DEBUG_JDWP worked for me, thank you Jeff!
https://www.salvis.com/blog/2019/04/08/using-dbms_debug-in-sql-developer/
https://stackoverflow.com/questions/44952521/oracle-debugging-wont-work-sql-developer-4-2-0-17/44959059#44959059
https://stackoverflow.com/questions/57612083/how-to-debug-oracle-11g-packages-procedures-in-docker-with-sql-developer
Otherwise,
I am having issues with JDWP:
Executing PL/SQL: CALL DBMS_DEBUG_JDWP.CONNECT_TCP( ‘XX.XX.XX.XXX’, ‘YYYYY’ )
ORA-30683: failure establishing connection to debugger
ORA-12535: TNS:operation timed out
ORA-06512: at “SYS.DBMS_DEBUG_JDWP”, line 68
ORA-06512: at line 1
I have a scenario that I have packages on production Database. Mostly I have to track the posted transactions e.g how many tables are being effected by current transaction, so that we have package of each module and many nested functions, functions inside function, so debugging “step into” could be a great idea. But I can’t compile the packages over and over again.
So my question is that, “is debugger compiles the package” if I directly choose to debug it ?
Sorry, I don’t understand your question.
You need to compile with debug the pl/sql objects you want to debug.
Why o why do we need to “compile for debug” ? Is it not possible for the user to skip this step. Personnaly, I don’t know someone who don’t set a breakpoint when he needs to debug. Thanks
Because that’s how it works.You can skip that step, but your breakpoints will be ignored.
Hi Jeff, Thanks for this tutorial. (I forgot). My point was much more why this process is not automatic in Sql Developer. When I work with any others IDE debugger, I don’t need this step. This is completely transparent for the end user. The compilation is just included in the procedure that starts the debug process. It’s much more simple for the end user and reduce the number of click. I need to click always two times to start the debug process and it’s really painful for my user experience.
by default, we compile with debug, i think – so unless you’re in PROD, it should probably already be there
if you’re debugging in prod, then you have bigger problems than the IDE
ALL of the oracle IDEs out there have this requirement – so your issue might be with how PL/SQL works in the database than with SQL Developer…
Thanks, Jeff!
Jeff,
We use Oracle On Demand so our servers are not on-site and we cannot use JDWP. With V4.0.3 you said we could edit ide.properties in \users\loginid\appdata\roaming\sql developer\system4.1.0.19.07\o.sqldeveloper12.2.0.19.7 and add the line “DatabaseDebuggerDisableJDWP=True”. I tried this but must not have put it in the right spot. Does this still work to disable JDWP? If it does, where/what is the correct initialization file to put it in?
Thanks,
Barry
you should put that in the ide.conf file in the sqldeveloper install directory
Jeff, I am now running V4.1.1.19 and I put
DatabaseDebuggerDisableJDWP=true
in C:\SQLDeveloper4.1.1\sqldeveloper\ide\bin\ide.conf
… as you previously suggested. SQLD is trying to connect with
CALL DBMS_DEBUG_JDWP.CONNECT_TCP …
so it looks like it is not working. Is there perhaps a different place to put this command, or is it no longer possible to disable the JDWP debugger?
Thanks for your help!
look in properties tab of about box, look for ide.system.dir. in that directory, look for o.sqldeveloper.12.x.x.x. in that directory is the ide.properties file. add the entry there
I put DatabaseDebuggerDisableJDWP=true in all of the the ide.properties files on my hard drive, but when I launch sql developer, debugging still doesn’t work, and the changes I made to the files are undone.
What version of SQLDev are you working with? Also, nice to meet you 🙂
4.2.0.17
It looks like I put DatabaseDebuggerDisableJDWP=true too far down in the script.
When put DatabaseDebuggerDisableJDWP=true on the first line, it worked.
Thanks, Jeff
Awesome.
Is it possible to script the launching of the debugger (eliminate mouse clicks and make a reusable script)?
The ultimate goal would be to with a single command:
1) execute a script that recompiles packages in debug,
2) launches the debugger listener
3) and then runs a test which connects to the debugger.
automating the debugger sounds a bit weird…but the answer is, I don’t think so. At some point you have to use the mouse in SQL Developer to enable the connection to listen for debug requests.
While debugging in Sql developer 3.1 we can see the below tabs buy default
Breakpoints
Smart Data
Data
Watches
But when debugging from Sql developer 4.1 all we see only in “Breakpoints” we dont see others, by default.
we need to add them explicity from View->debugger options before debugging starts. can this be changed to default? (like how it works in 3.1)?
try resetting your desktop layout, Windows > Reset to Factory