
Haven’t had much time to blog this week, so what’s a blogging addict to do? Ask your readers for help!
@thatjeffsmith kind of like db instance but more focused. I picked 3 just to give an idea. Refresh would be on all. pic.twitter.com/WUlWyUbeT3
— Nando Somoza (@slaytanic70) September 10, 2015
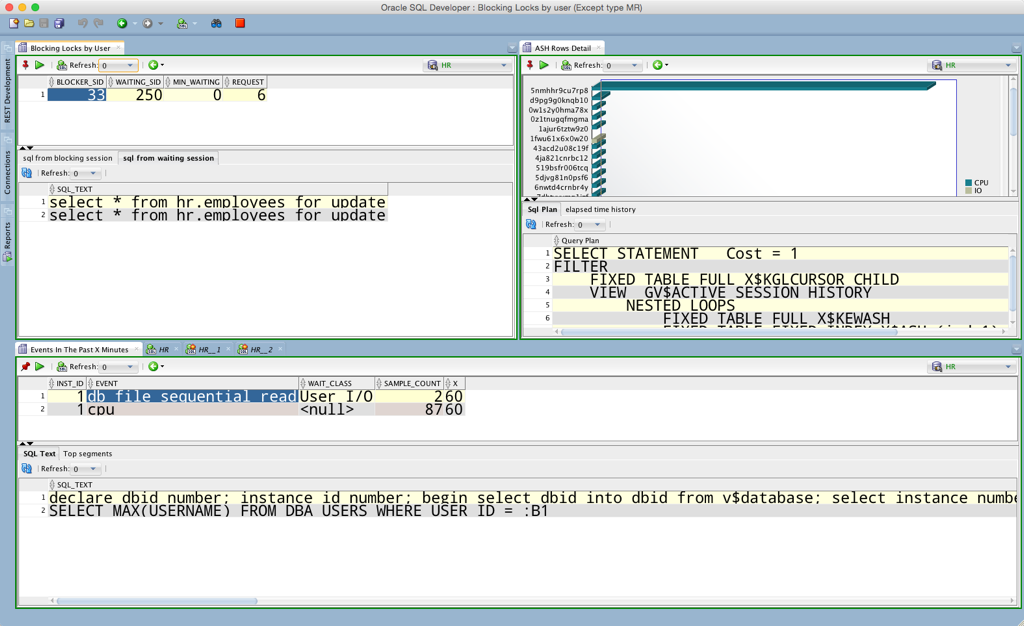
So I put together this view for Nando…3 reports running all at once, and all displayed at once.
- Blocking Locks by User (top left)
- ASH Rows Detail(top right)
- Wait Events in the Past X Minutes(bottom)
The Tricks
I suppose these are ‘tricks?’
If you’re new to this blog, the only real trick is going to be with the Document Tab Groups concept, but that’s pretty easily figured out once you start playing with it.
It’s also the easiest way to ID yourself as an ‘advanced SQL Developer user’ 🙂
- Pin your reports – if you don’t, when you open a new one, the previous one will close
- Create multiple document tab groups – drag them to where you want them to go
- Set your refresh period as desired
These are pretty straightforward, but for the multiple doc tab groups – I put one of them BELOW the others. I usually show this feature by putting them to the right of the existing documents.
Just drag your document (in this case the report) and drag down to the area where your log panels are. When it starts to draw the docking space, let go of your mouse.
Beware some of these reports hit $$$ views. You’ll be prompted before opening to make sure it’s OK to hit the Diagnostic Pack bits of the database.
Refresh rates are listed in seconds. If it’s a really long running query, you might want to make sure you stagger those appropriately or setup separate connections so you don’t get ‘connection busy’ messages.


4 Comments
If only there was a way to save the view of the 3 reports…
Great article though! Again!
Great article! I’m relatively new to SQL Developer (about 3 months), but I am more and more impressed with it. Your blog is one of my favorite resources.
I do have one question about this blog entry. What are “$$$ views” as relates to your comment:
Beware some of these reports hit $$$ views. You’ll be prompted before opening to make sure it’s OK to hit the Diagnostic Pack bits of the database.
Data Dictionary Views that are licensed via the Diagnostics Pack, e.g. The V$ACTIVE_SESSION_HISTORY dynamic performance view and its underlying table, X$ASH, are part of this pack
Querying these views will trigger the license auditing views to reflect you have used the Diagnostics Pack. Which means you will need to pay for it.
BTW, welcome to the world of SQLDev and thanks for sharing your thoughts here!