Today’s post is inspired by Karin’s LiveLab demonstrating Property Graphs. You can take a look at that here.
If you choose to run this lab ‘on your own,’ you’re given a few CSV files to load up two tables. You can now do this in VS Code with our SQL Developer extension!
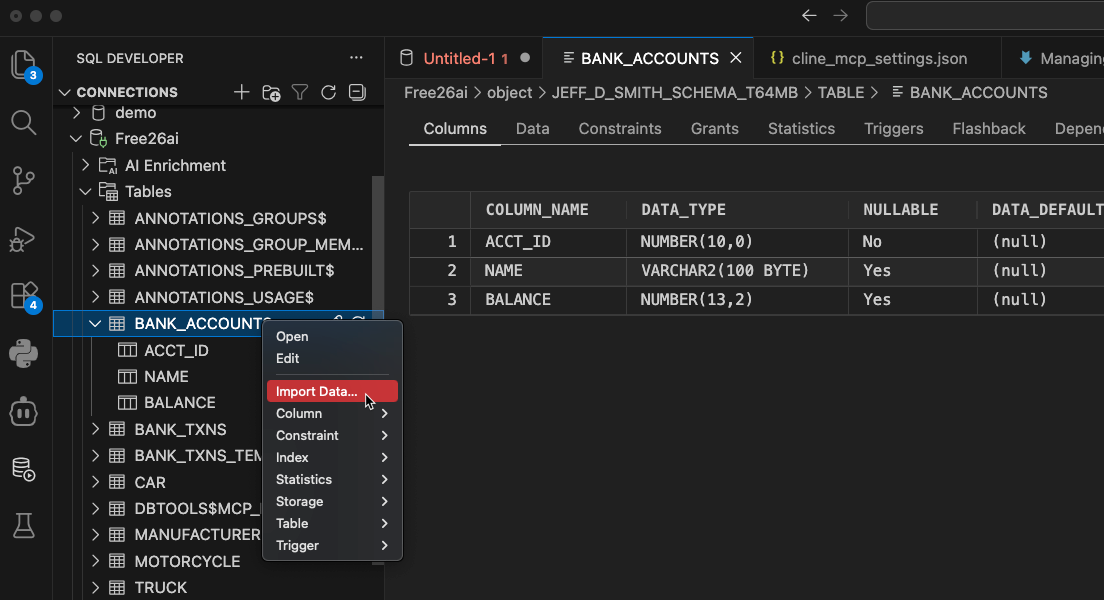
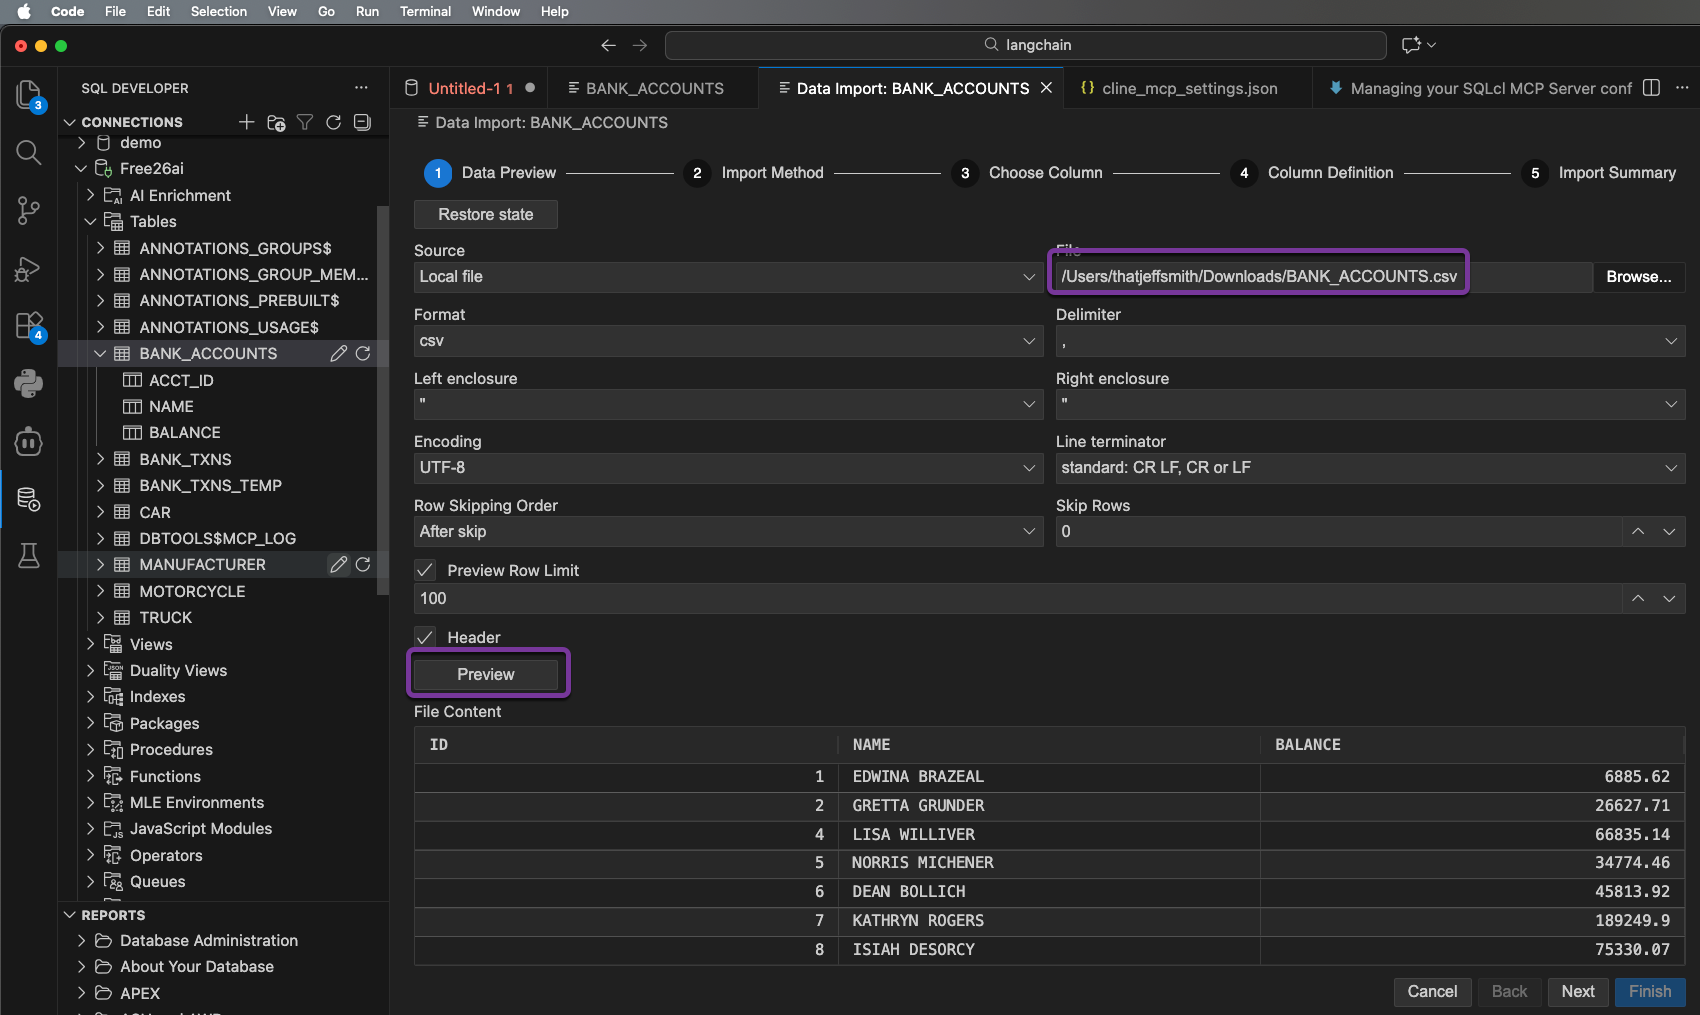
This will load up a 5 step ‘wizard.’
Step ‘1’ defines the source file and the specifications of the file. Once you have the parameters defined, hit the ‘Preview’ button. If your data looks good, you’re ready to hit the ‘Next’ button.
My mappings are straightforward – the order and names of the csv fields match up to the table, so if I ‘skip to the end,’ I can simply hit the ‘Finish’ button.
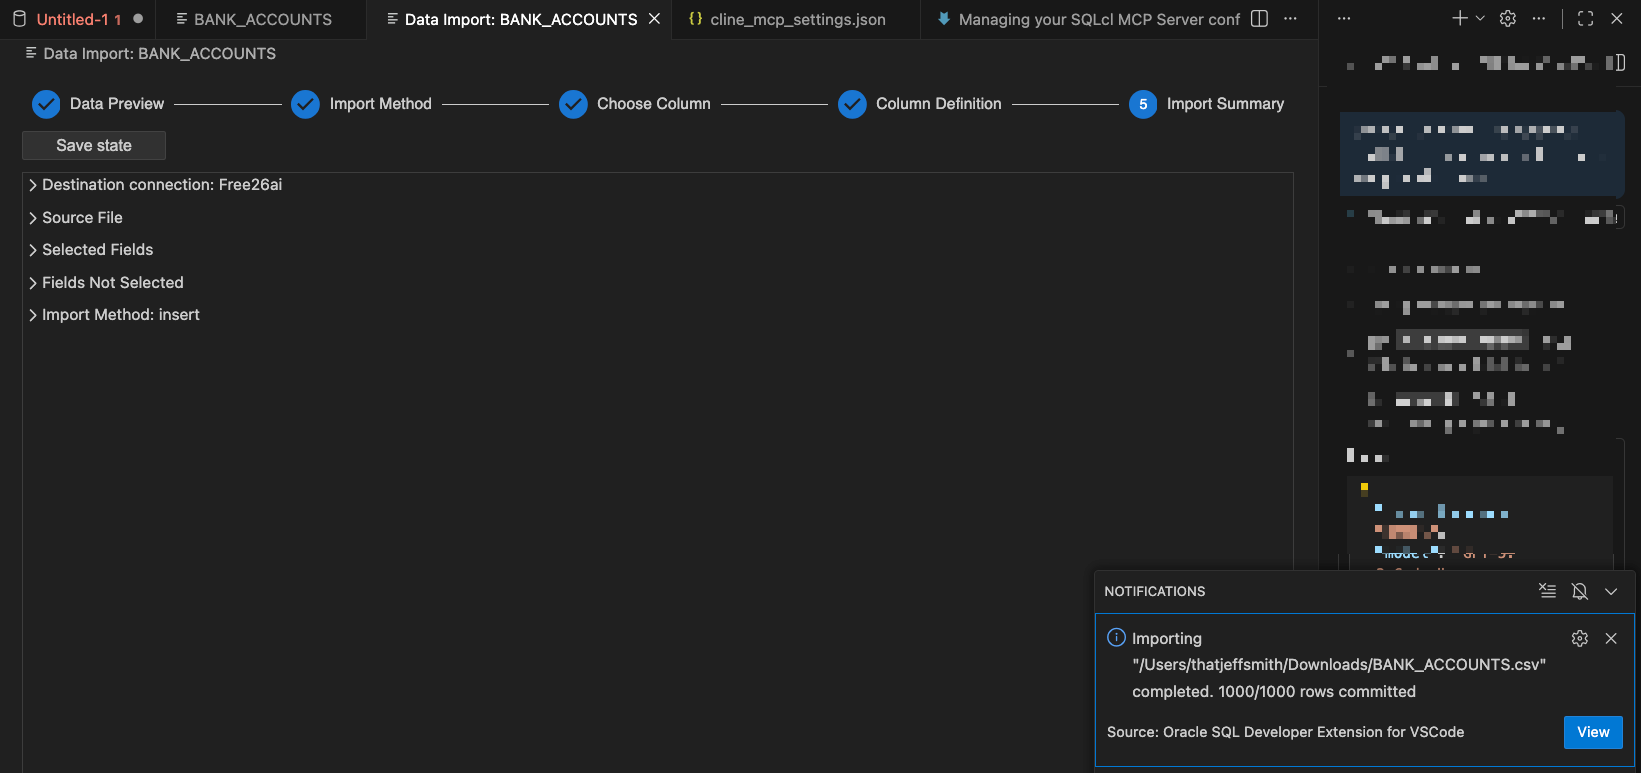
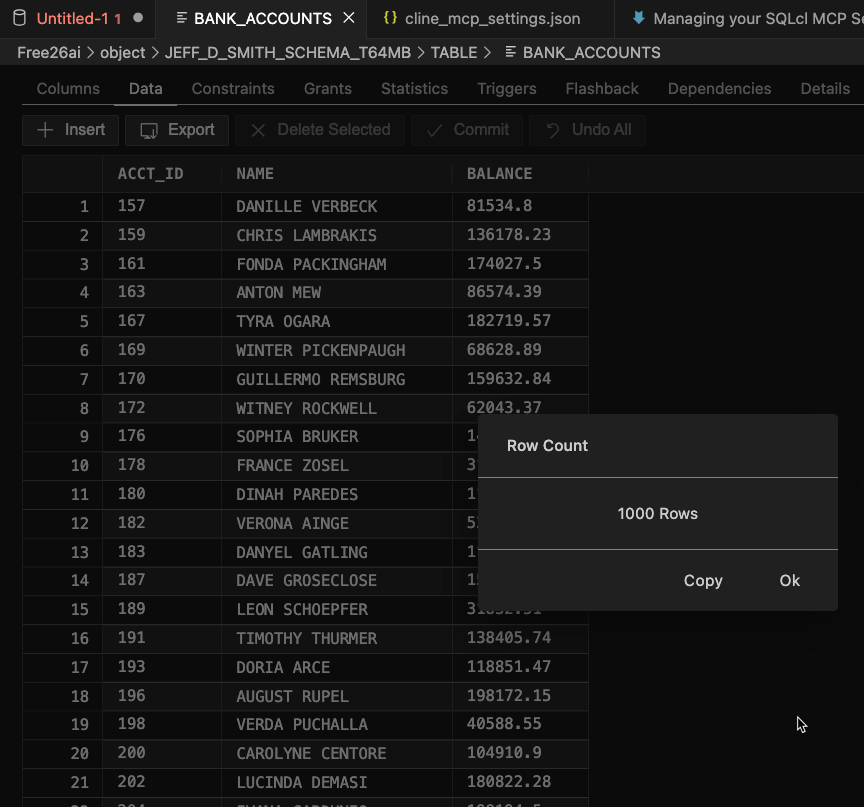
I got all my data loaded, and if I’m paranoid I can always open the table and browse the Data page, or ask for a Row count.
Things you need to know
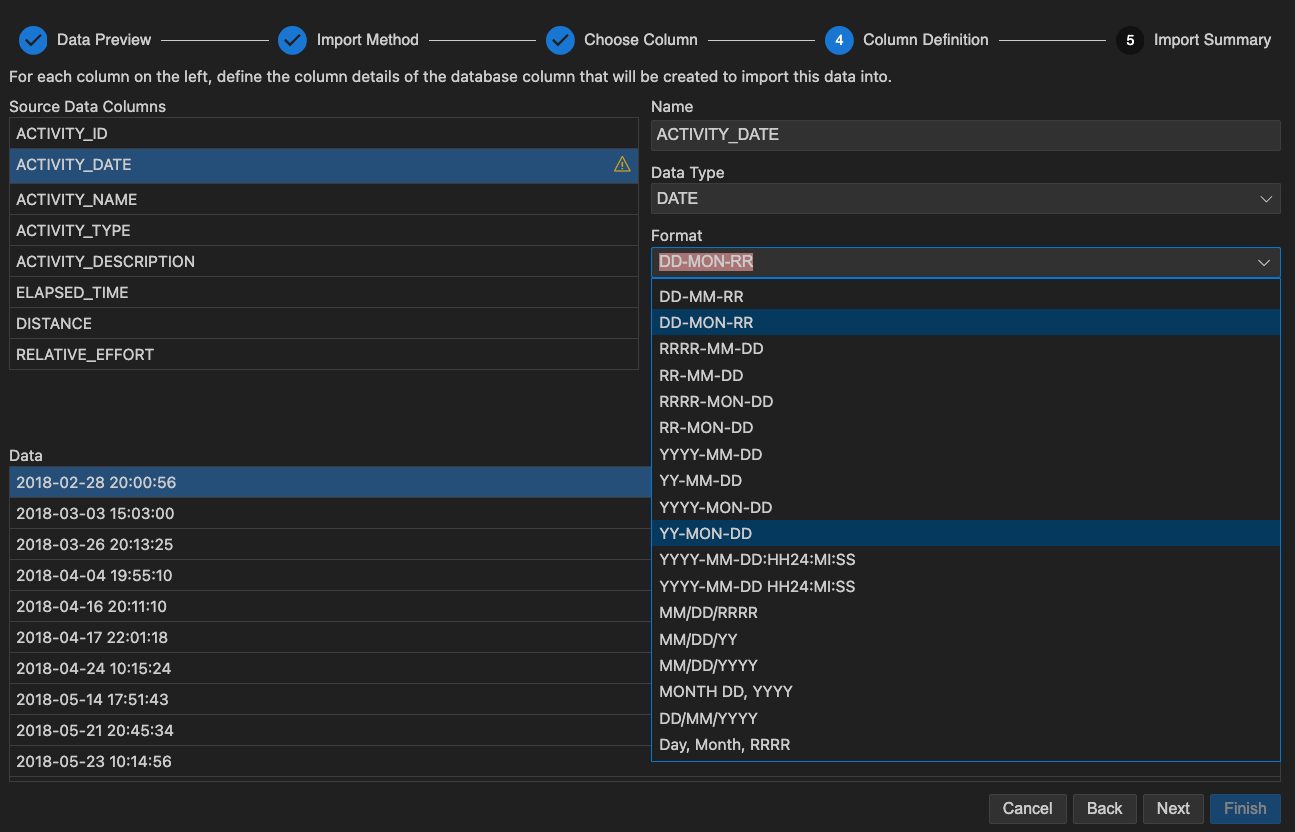
If there are columns that require more information to correctly map the data we’ll ‘paint’ the screen. The most common occurrence here will be if you’re working with dates or timestamps – you’ll need to supply the format so we can properly construct the TO_DATE calls.
Once the wizard is completed, you’ll notice the dialog or page stays open. So if I want to pick a new file, or make some changes and run it again, I only need to hit the ‘Finish’ button, again. When I’m done-done, simply close the document/window.
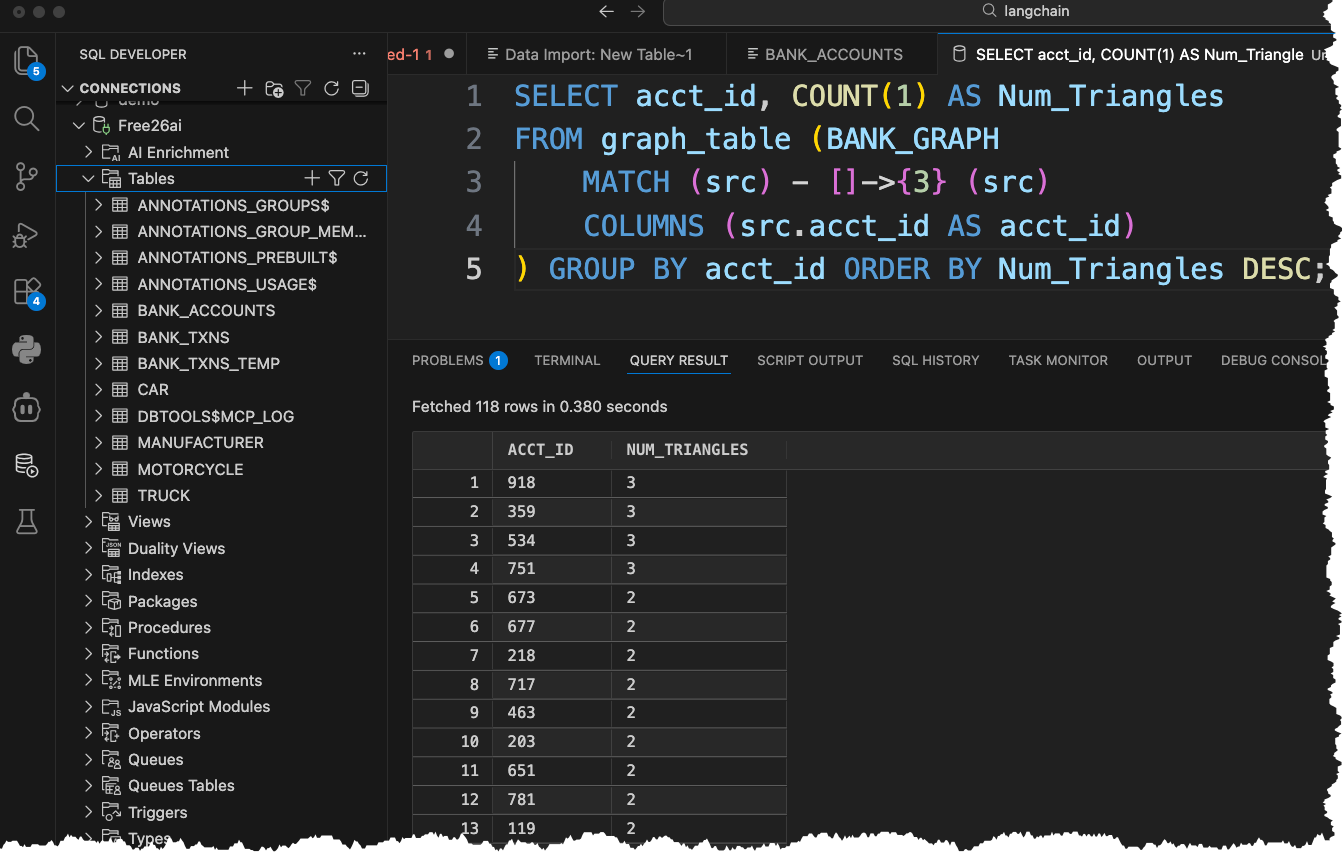
I’ve loaded 6,000 rows or so to my new property graph demo tables, so let’s try a query
Before you can run this, you’ll be prompted to ‘sign in’ – having an authenticated session on FreeSQL gives you your own schema, so you can then create your own tables, indexes, property graphs, etc.
But wait, I need data??
You can connect to your own 26ai Oracle Database with our VS Code extension, using FreeSQL.com.
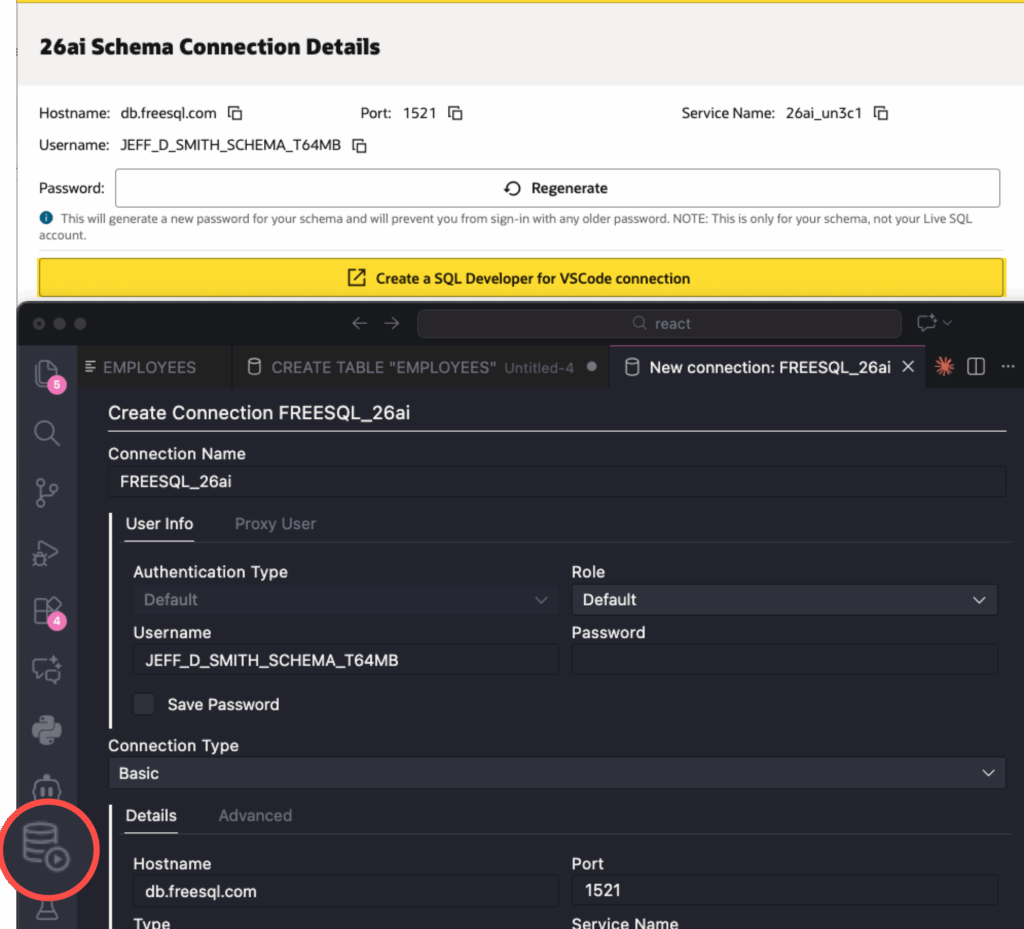
Once you’re connected, then you can use our new data loaders.
You can find the src CSV files here.
If you get that data loaded, your query results should look like this –