A customer recently approached us for help: their REST API was too slow. This REST API was powered with SQL. And, their APIs were taking much longer than same SQL would run from say, SQLcl. We want our customers to be successful, so it’s not uncommon we spend time helping customers, tuning REST APIs (and their SQL!)
Their API was taking 290 milliseconds vs 68 milliseconds for the query to execute. Both of those numbers sound fast, but one is 380% faster than the other. And when we have network latencies with lots of concurrent requests, EVERY MILLISECOND COUNTS.
Our Mission: Make this API FASTER
It’s tempting to jump into a call like this and just start barking advice. But really the recipe for success is more like, sit back and listen to the customer.
It came to be understood that almost ALL of their APIs were running Jim-Dandy (that’s fast.) But there were a few in particular that were causing problems.
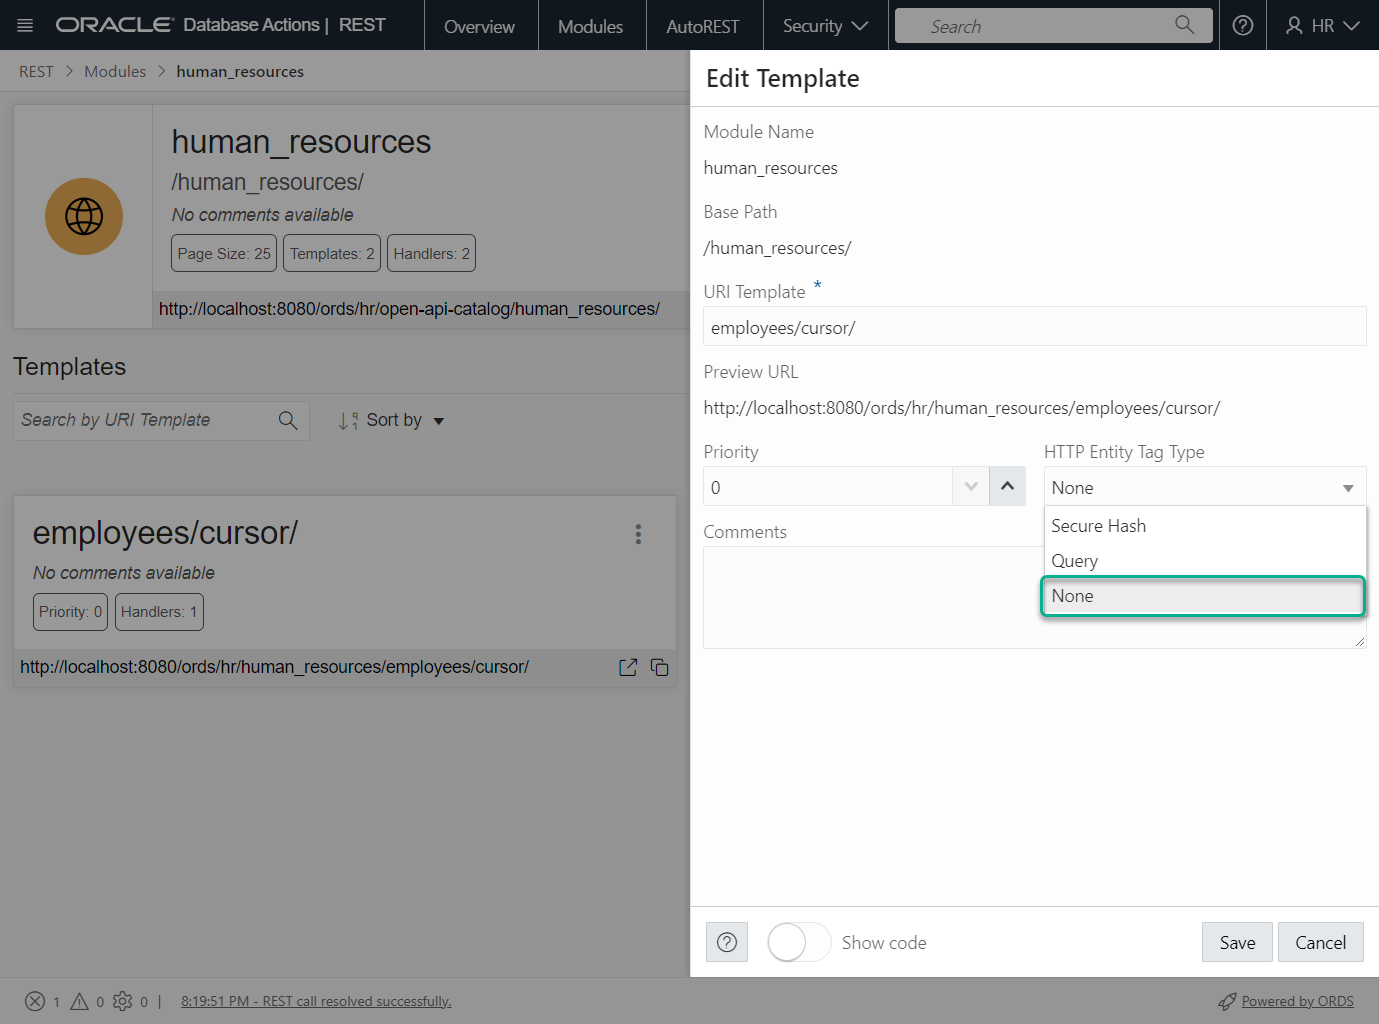
I asked to see their API definition. I thought at first perhaps they were using DB Authentication – but that would slow down ALL of their APIs. Then I thought maybe they were doing something weird with paging.
But when we saw their SQL, something struck me right away.
select department_name,
 cursor(
     select first_name,
            last_name,
            salary
  from employees E
 where D.department_id = E.department_id
 ) employees
from departments D
When we tie this to a REST API, the response looks like this –
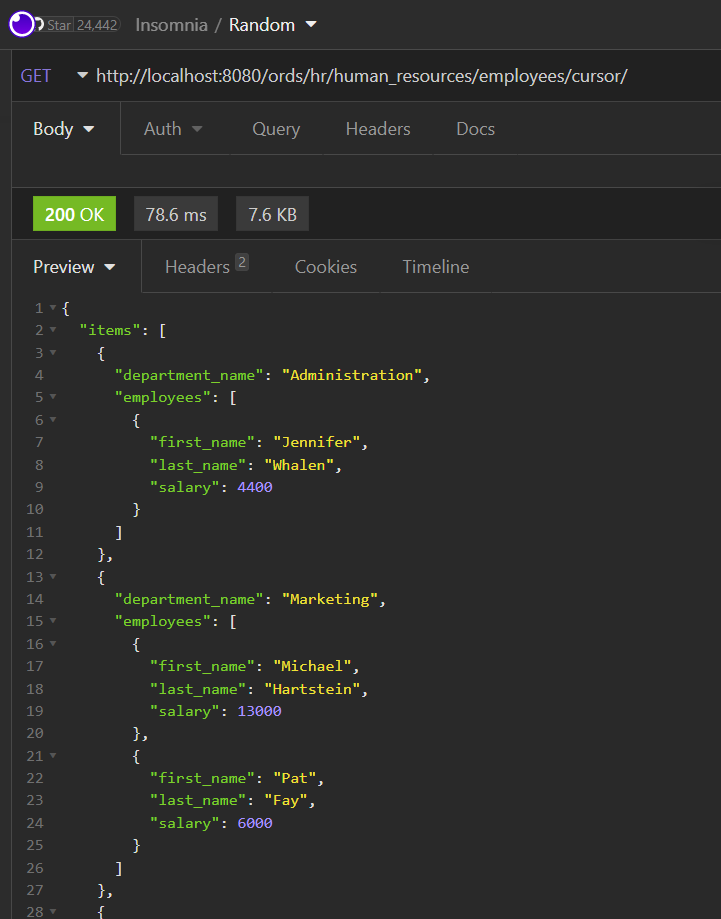
Yes, I know you can see in the picture that the response time is 78.6 msecs, but that’s a one time only request and response. That’s not even close to real-world.
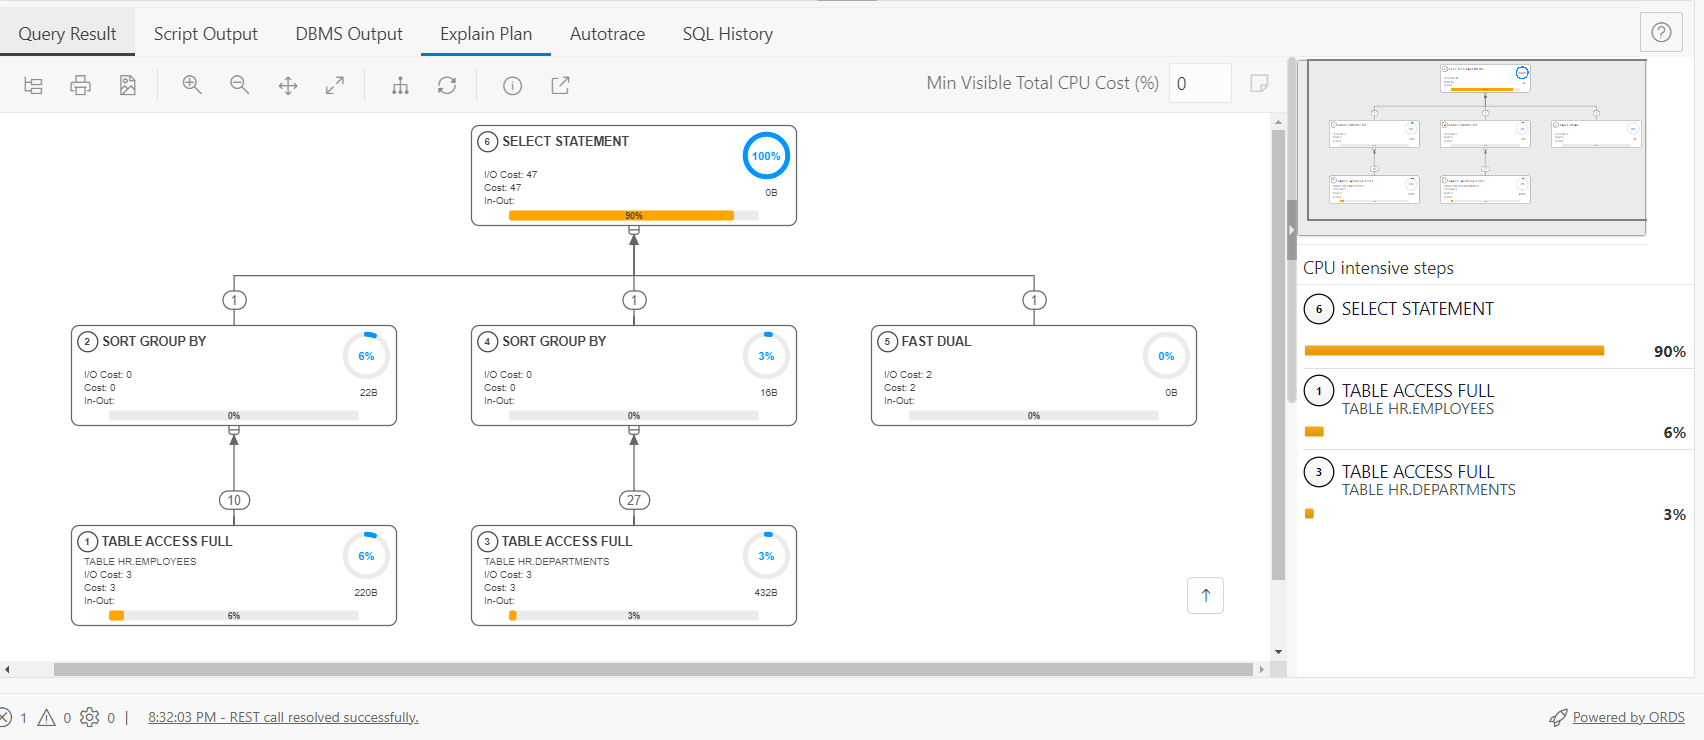
The execution plan for this is pretty simple –
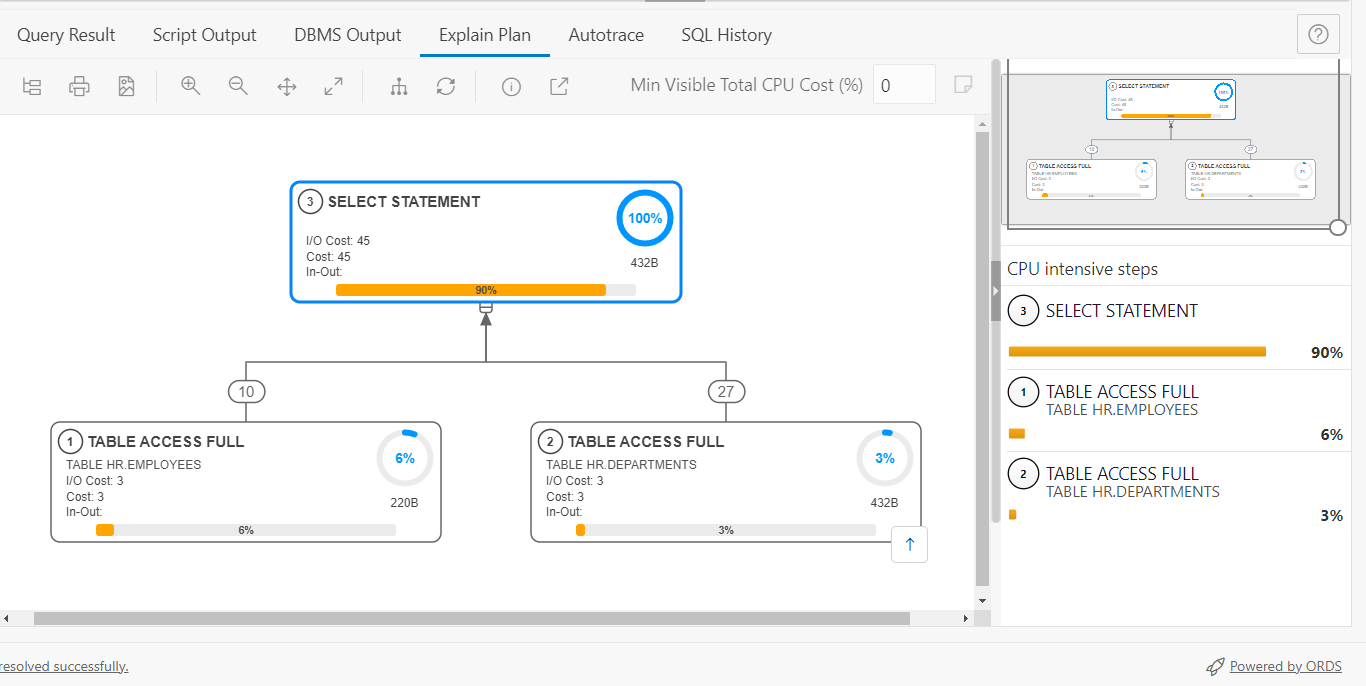
Like our new plans? It’s a new feature for ORDS 22.3.
So, why IS the ORDS REST API taking longer?
In general, the REST API will always take a bit longer than the RAW SQL or PL/SQL powering it. Let’s take a HTTPS request and response trip down an ORDS REST API:
- GET Request is issued from Client.
- Request lands at Webserver – there may also be a load balancer.
- Request is recognized belonging to ORDS servlet.
- ORDS figures out the appropriate connection pool, and grabs a connection.
- ORDS issues a query to figure out the required privs to access the resource.
- ORDS issues a query to get the SQL/PLSQL behind the resource.
- IF you are using Database User/Basic Auth – we make a database connection to test your username and password (Expensive!!)
- We proxy connect from ORDS_PUBLIC_USER to the API Schema.
- We run the query.
- We get the results, and write it out to JSON.
- We hash the JSON payload for the ECID.
- We send the payload back down to the requestor.
- We give the connection back to the pool, or may not if you have connection re-use enabled.
This list isn’t exactly, 100% accurate. By that I mean some of those steps are happening concurrently, and not necessarily in that exact order. But, more or less…there’s a lot going on. Don’t forget to add the network time between your mid-tier and database. We want ORDS as close to the database as possible!
Helping our API go faster.
There is some easy things to try first. Easy basically meaning little to no code-changes. And then after all of that, there’s a matter of trying to speed up the SQL itself. By the way, we reckon that in almost every single case, slow APIs/Apps come down to poorly written SQL and PL/SQL.
Make it fast #1 – Don’t use Database Auth
IF you are using Database User/Basic Auth – we make a database connection to test your username and password (Expensive!!)
Instead, use OAuth2, or move Auth up the chain to your load balancer, API Gateway, or Web server. My very simple test showed immediate 3x performance when switching off of Database Authentication.
Make it fast #2 – eTags? USE them or disable them
eTags are awesome. They allow the webserver to communicate to the client, that the data they’ve already received on prior requests…hasn’t changed. So when I ask for my ’employees’, ORDS can tell you, hey you already got ’em. It cuts out a ton work/IO/network.
Kris shows how to go from 86 requests/sec to 271 req/sec, simply by using eTags.
Make it fast #3 – enable the metadata cache
ORDS issues a query to figure out the required privs to access the resource.
ORDS issues a query to get the SQL/PLSQL behind the resource.
With this feature, we do that lookup ONCE, and then store the information in a local cache. You’re good until it expires. This can make things again, MUCH faster.
Kris shows here how he went from 12,000 requests/minute to 55,000 requests/minute.
Make it fast #4 – tuning the SQL
This is the ‘hardest’ fix. There’s no ‘easy button.’ No, you have to go write, or rewrite some code.
Cursors aren’t bad. However, the way our JDBC driver handles cursors is a bit different than what the execution plan above shows.
The driver itself gets our department and then does more work on separate threads to get the employees. As the size of the results increase, so does the work. And as the number of users running this concurrently increase, so do the response times. The customer was seeing exactly this trend when load testing their APIs that had a SQL cursor.
Note that in this customer’s scenario, their endpoint SQL used 3 cursors. So that was a lot of round-trippin’!
Avoiding the Cursor, let’s make the JSON ourselves!
Instead of having SQL run that ORDS then turns into JSON, you have another option. You can generate the JSON, yourself.
Modern versions of Oracle (12.1 and higher), include functions for turning SQL results sets into JSON arrays and objects.
Here’s my hurried attempt at replicating what the SQL above was doing, without using a CURSOR:
SELECT JSON_OBJECT (
         KEY 'departments' VALUE (
           SELECT JSON_ARRAYAGG(
                    JSON_OBJECT (
                      KEY 'department_name' VALUE d.department_name,
                      KEY 'department_no' VALUE d.department_id,
                      KEY 'employees' VALUE (
                        SELECT JSON_ARRAYAGG (
                                 JSON_OBJECT(
                                   KEY 'first_name' VALUE e.first_name,
                                   KEY 'last_name' VALUE e.last_name,
                                   KEY 'salary' value e.salary
                                 )
                               )
                        FROM   employees e
                        WHERE  e.department_id = d.department_id
                      )
                    returning clob)
                  returning clob)
           FROM   departments d
           )
       returning clob) AS "{}items"
See the JSON Developer’s Guide for takes on all these functions.
The ‘as “{}items” ‘ alias at the end of the SELECT tells ORDS that the incoming payload is already JSON, and there’s no need to rewrite it.
Apologies to the JSON team if that SQL isn’t the best, but it should give you an idea of what can be done. One final note on the SQL, if you’re not on version 23c of the database, you’ll need to add a ‘FROM DUAL’ at the end.
If we look at the plan for the new query, we can see a similar cost to our previous version of the SQL, 47.
Let’s look at the response from our new request –
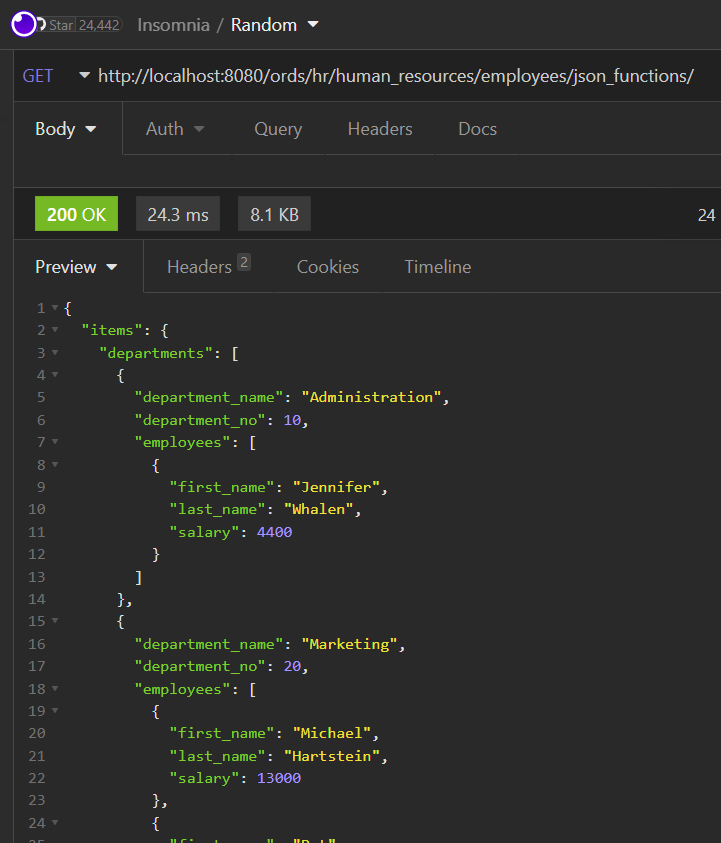
So, it already SEEMS faster, case-closed? No, this is just an ad-hoc, one-off test. What can we do to get better answers? Load testing.
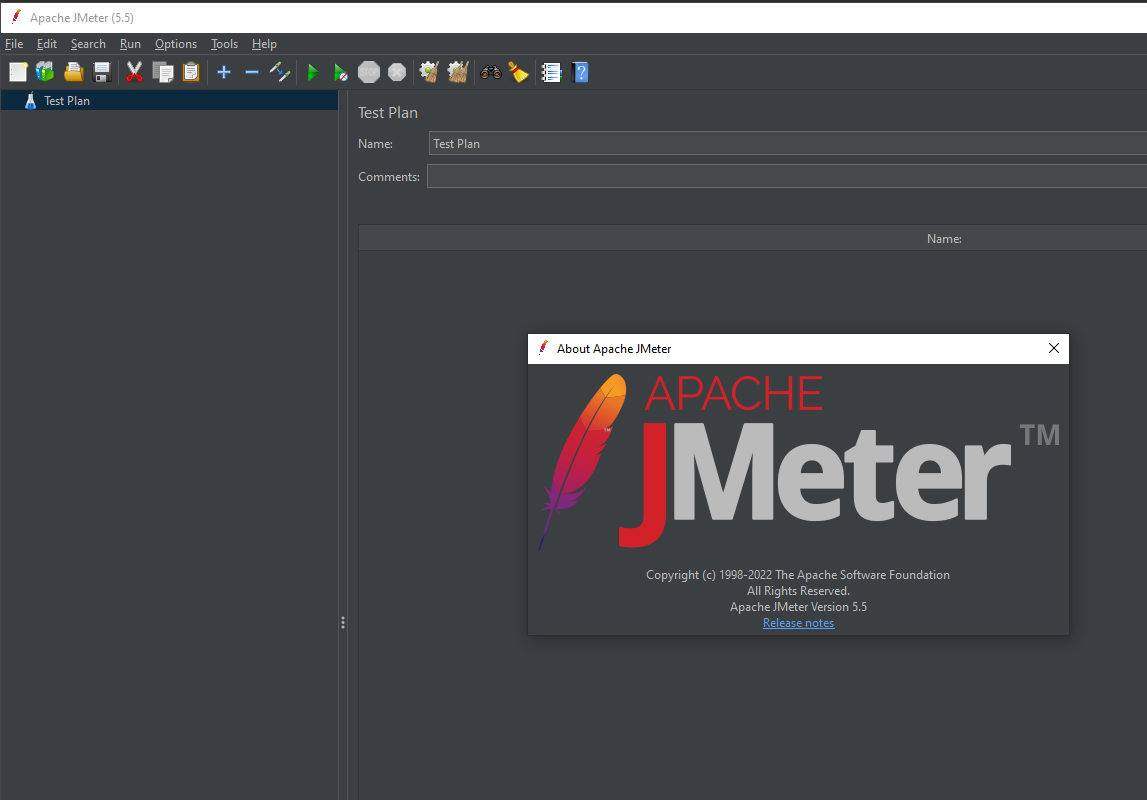
JMeter enters the room.
It’s free. It’s pretty well known. It’s a Java app, and I kinda know how those work. Plus, Kris uses it, so if I get stuck, I can go bother him.
Our ‘Dumb’ JMeter test
We’re going to setup ’25 users’ and have them each make 100 requests, so a total of 2500 HTTP GET requests. This will give us a range of response times, with a nice ‘average’ at the end.
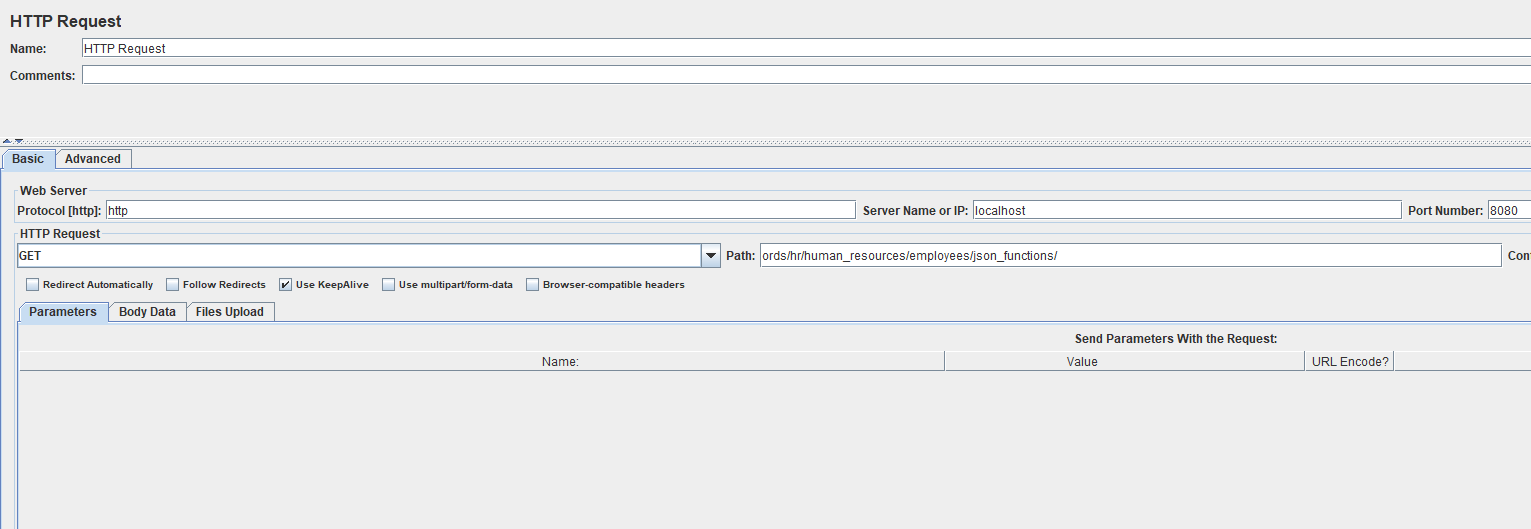
My test has no authentication. And eTags are disabled. I have a VBox instance of the database running on the same physical machine as ORDS, so network latency is theoretically 0ms.
I have one test definition, it will run the first scenario, and then the second.
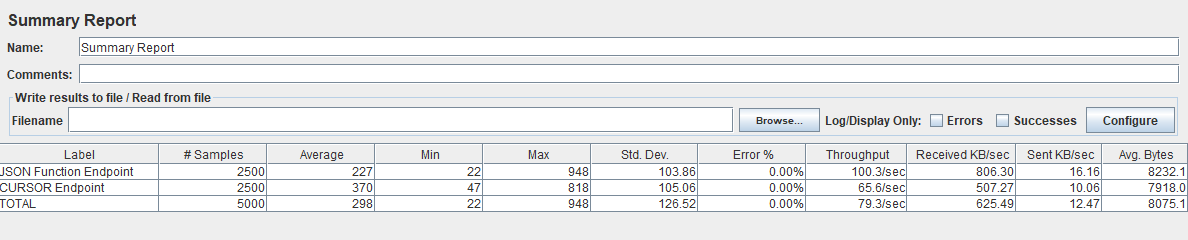
JSON FUNCTION 227 ms avg resp and 100 requests/second.
So that’s better. Significantly better? Remember, every ms counts!
Are we done tuning? Maybe. People that tune SQL for a living know they can look at AWR reports, check for proper indexing schemes, ensure your stats are correct, that your database is properly patched…
I ‘broke’ ORDS – how to grab bigger pools
Having 10 processes ‘slam’ ORDS with the requests, and then again, 50 more times…I overwhelmed my default connection pool.
The default ORDS connection pools isn’t suitable for really, anything except for single user scenarios.
I knew the pool got cranky as I saw some failure and my ORDS log shows –
        at org.eclipse.jetty.util.thread.QueuedThreadPool.runJob(QueuedThreadPool.java:894)
        at org.eclipse.jetty.util.thread.QueuedThreadPool$Runner.run(QueuedThreadPool.java:1038)
        at java.base/java.lang.Thread.run(Thread.java:833)
Caused by: oracle.dbtools.url.mapping.TargetNotAvailableException: ORDS was unable to make a connection to the database.  This can occur if the database is unavailable, the maximum number of sessions has been reached or the pool is not correctly configured. The connection pool named: |default|lo| had the following error(s): Exception occurred while getting connection: oracle.ucp.UniversalConnectionPoolException: All connections in the Universal Connection Pool are in use - [ 10, 10, 25, 15, 0, 10, 13, 0, 9 ]
        at oracle.dbtools.url.mapping.db.PoolInjector.inject(PoolInjector.java:65)
        at oracle.dbtools.url.mapping.db.DatabaseURLMappingBase.addServices(DatabaseURLMappingBase.java:390)
        at oracle.dbtools.jdbc.pools.JDBCPoolURLMapping.addServices(JDBCPoolURLMapping.java:99)
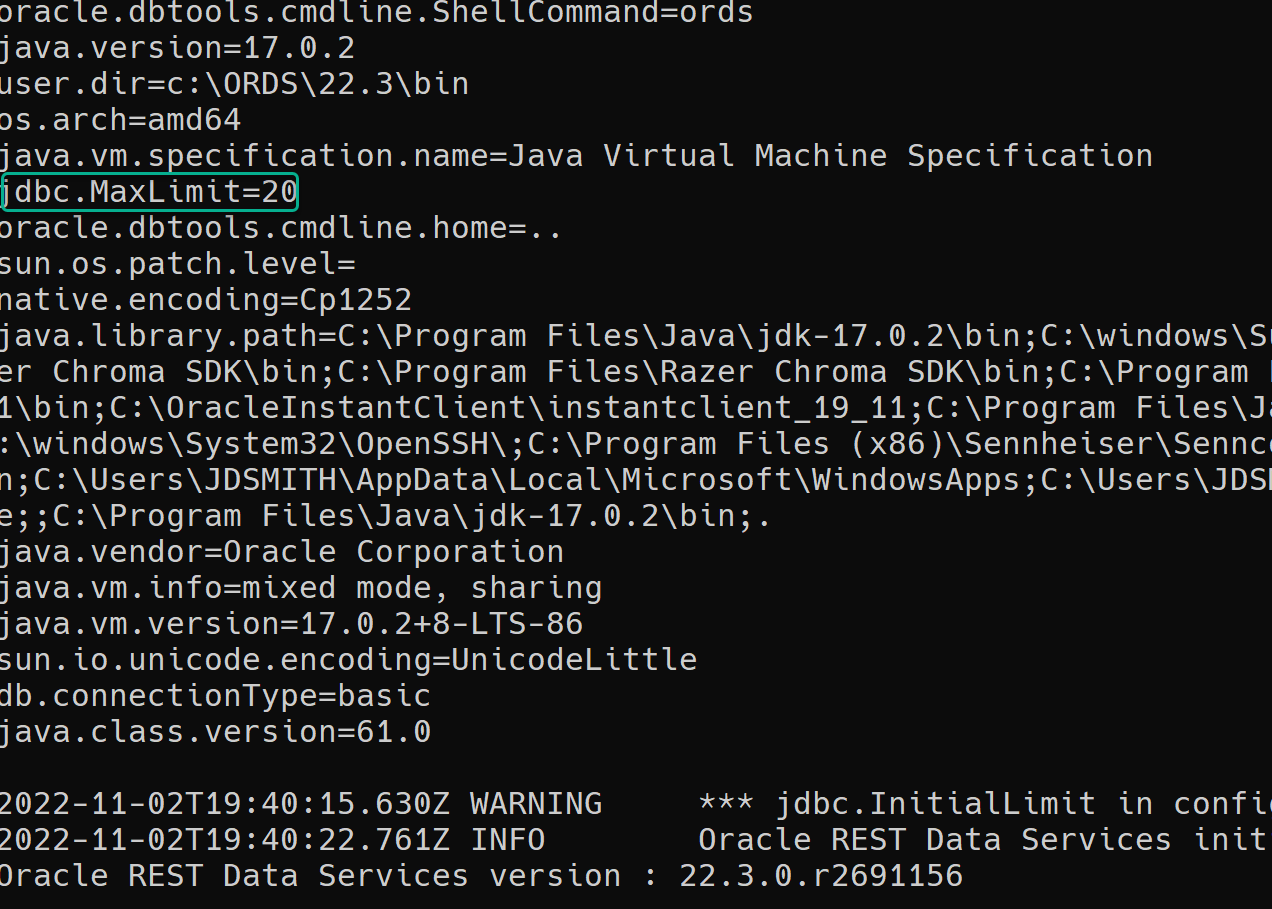
10 connections were in use, that’s the default max size of the UCP. The fix is easy!
Just bump up the Max Pool size.
We’re going to set ‘jdbc.MaxLimit’ to 50 vs 10. Settings are documented here.
c:\ORDS\22.3\bin>ords --config c:\ords\23c_config config --db-pool default set jdbc.MaxLimit 50

ORDS: Release 22.3 Production on Wed Nov 02 19:13:24 2022

Copyright (c) 2010, 2022, Oracle.

Configuration:
  /C:/ords/23c_config/

The setting named: jdbc.MaxLimit was set to: 50 in configuration: default
And then when I start ORDS back up, I can see my setting has been accounted for, AND my tests worked until completion 🙂
After restarting ORDS, I ran the test once to make sure the pools/connections were ‘warm,’ and then I ran the test again.
Tuning REST APIs is fun!
Just make sure to break the problem down like you would anything else. Don’t jump to conclusions, and bring FACTS to the table. Then have a good test environment where you can try out different strategies. Don’t’ throw in everything at once, and don’t even get me started at query / optimizer hints!