
Anyone who can reach this URL will be able to see my Strava data, that’s what I mean by ‘Public.’ It’s not locked down with any security privilege or access control list on the webserver.
Do me a favor…go click on that and have a go at the data now.
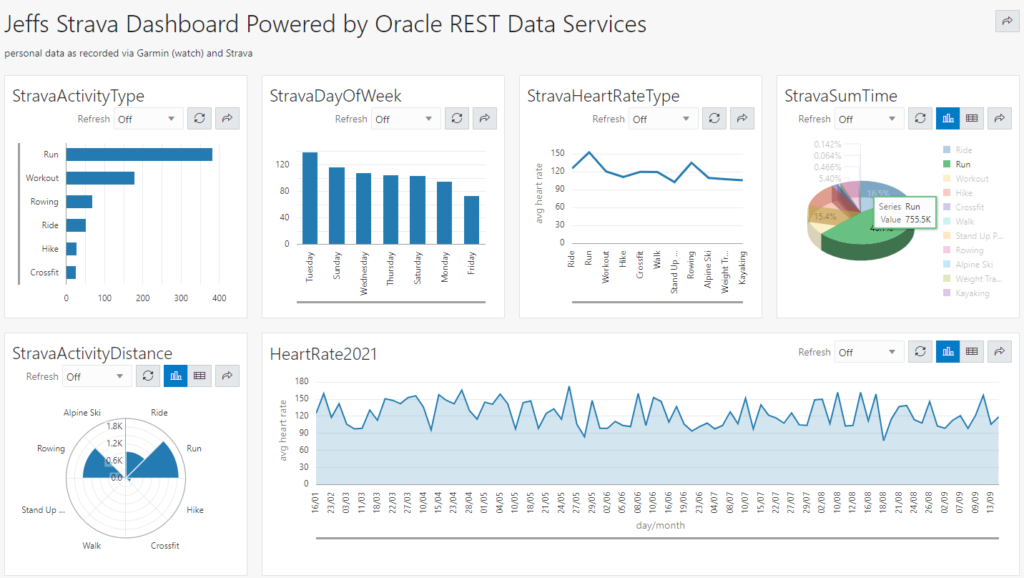
What you should see:
- 6 charts
- some of those charts can be toggled to a Grid view to see the raw data
- each have a ‘refresh’ feature – but my data is static, so no fun there
- mouse over the chart to see the data points, the pie charts are fun to play with especially
- open up your browser developer tools if you want to see the REST APIs involved
- share buttons for the dashboard and each chart for quick-and-easy embeds
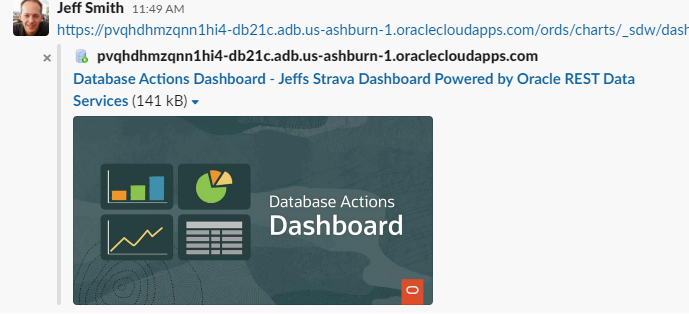
Embeds will look like this for example, in Slack –
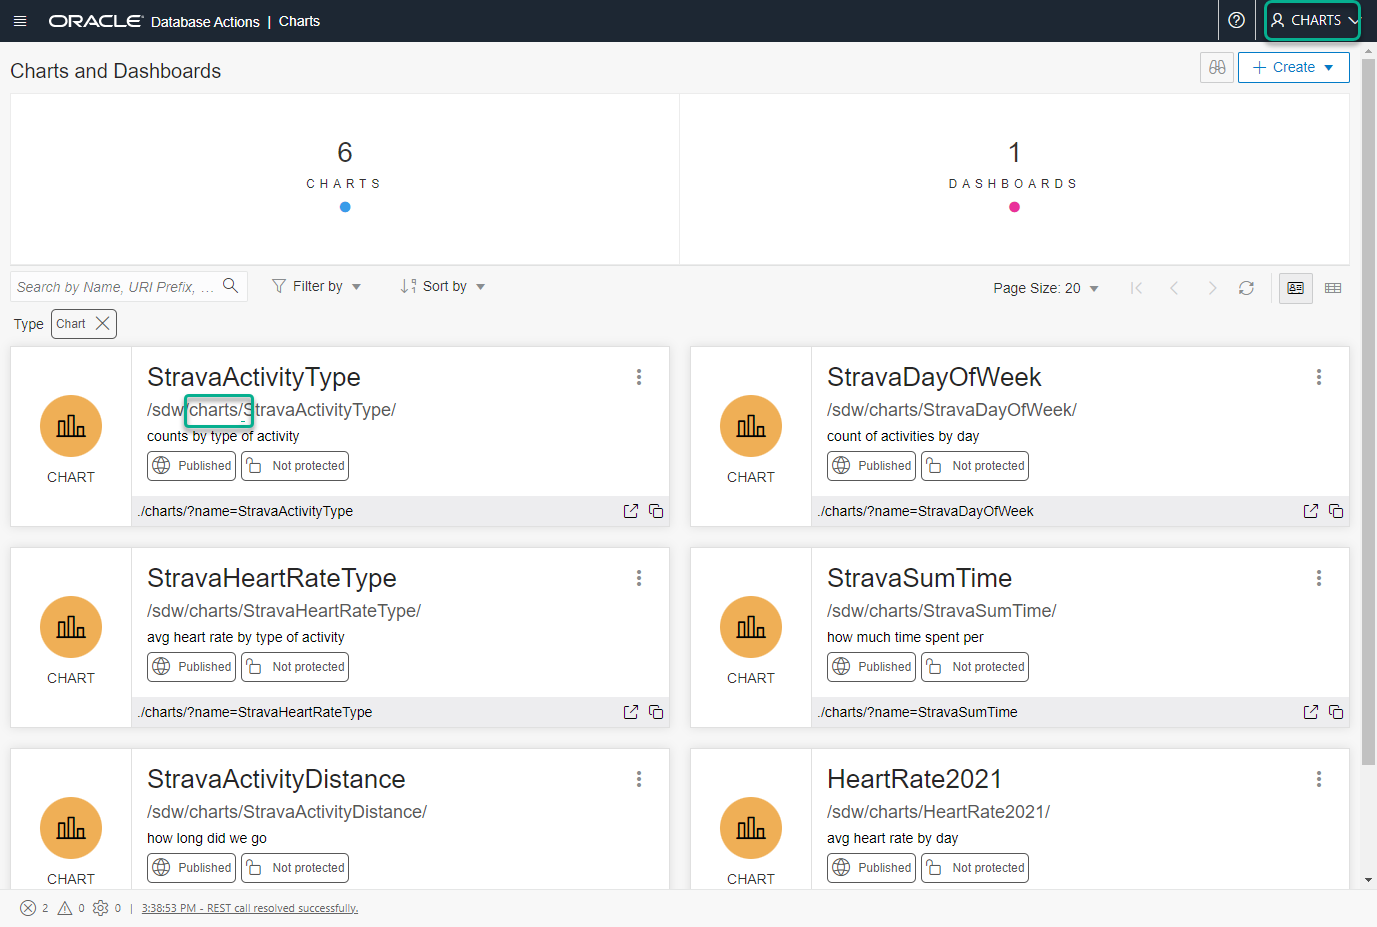
What are we looking at?
This is one of our new SQL Developer Web features – Charts. Charts are a visualization of a defined SQL query’s result set. A dashboard is one or more charts grouped together. Opening a Chart or Dashboard will cause the one or more queries to be executed.
If your session isn’t already authenticated and authorized, you’ll be prompted for sign-on credentials – if said charts and dashboards are protected by an ORDS Privilege.
I’ve talked about Charts before, from start to finish here.
Sharing My Data
By making this ‘Dashboard’ open or public, what am I serving up, exactly? Well, you’ll be able to access the REST endpoints that back this page, and it’s associated charts.
My Charts/Dashboards/REST APIs are defined in a schema called ‘CHARTS.’
Those charts call SQL that query a table in a different schema, which we’ll call ‘DATA’.
There is no Strava data in my CHARTS schema.
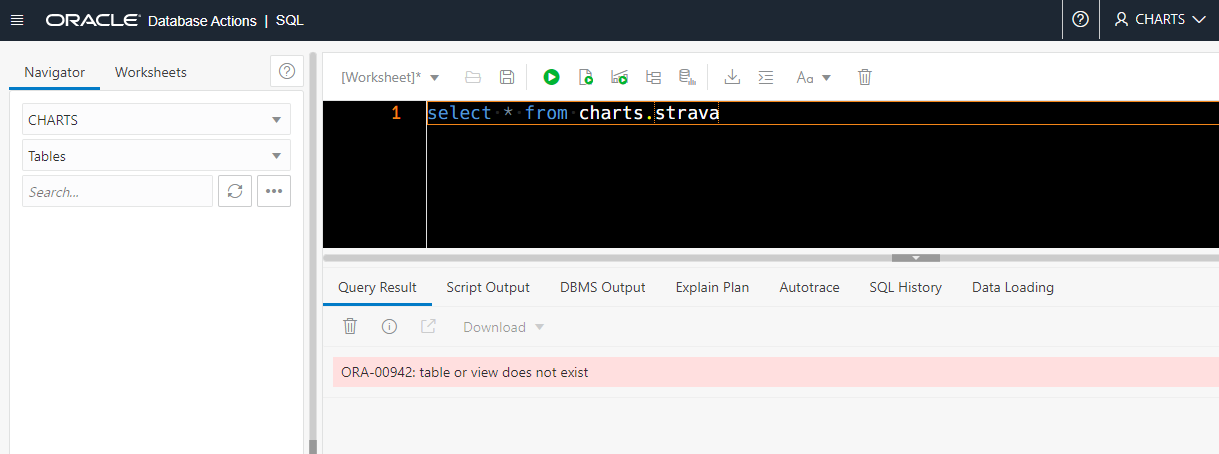
I’ve granted READ on my STRAVA table in DATA to my CHARTS user.
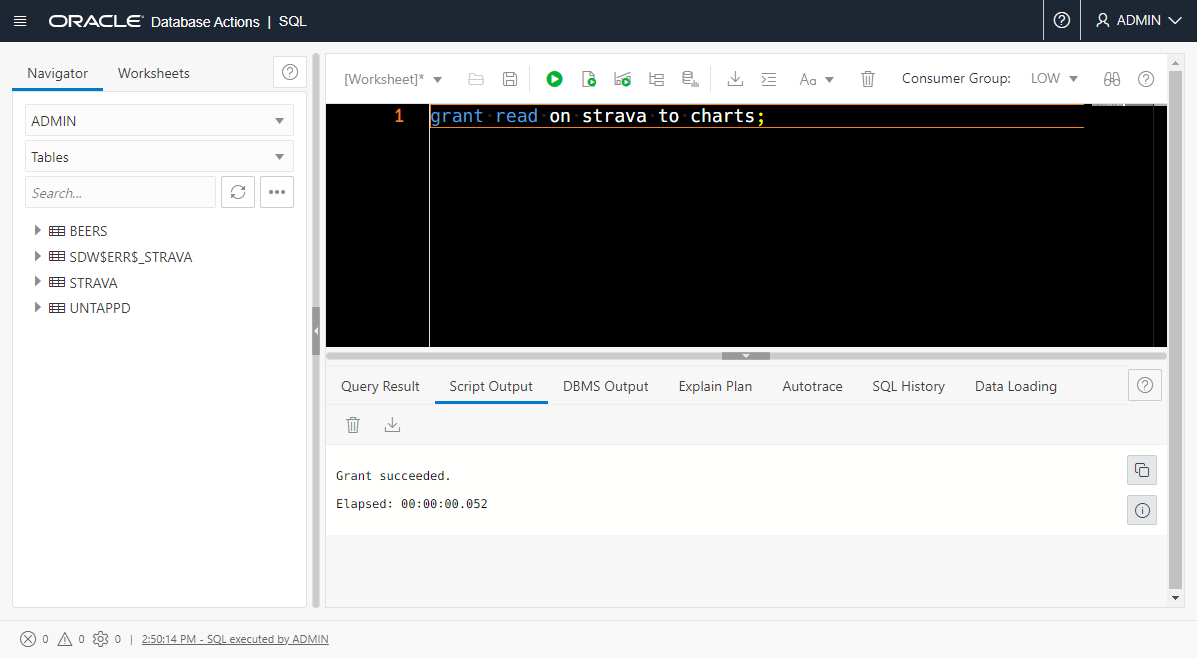
The READ privilege is effectively the same as SELECT except that it doesn’t not allow SELECT FOR UPDATE (which will create locks and block others – BAD!)
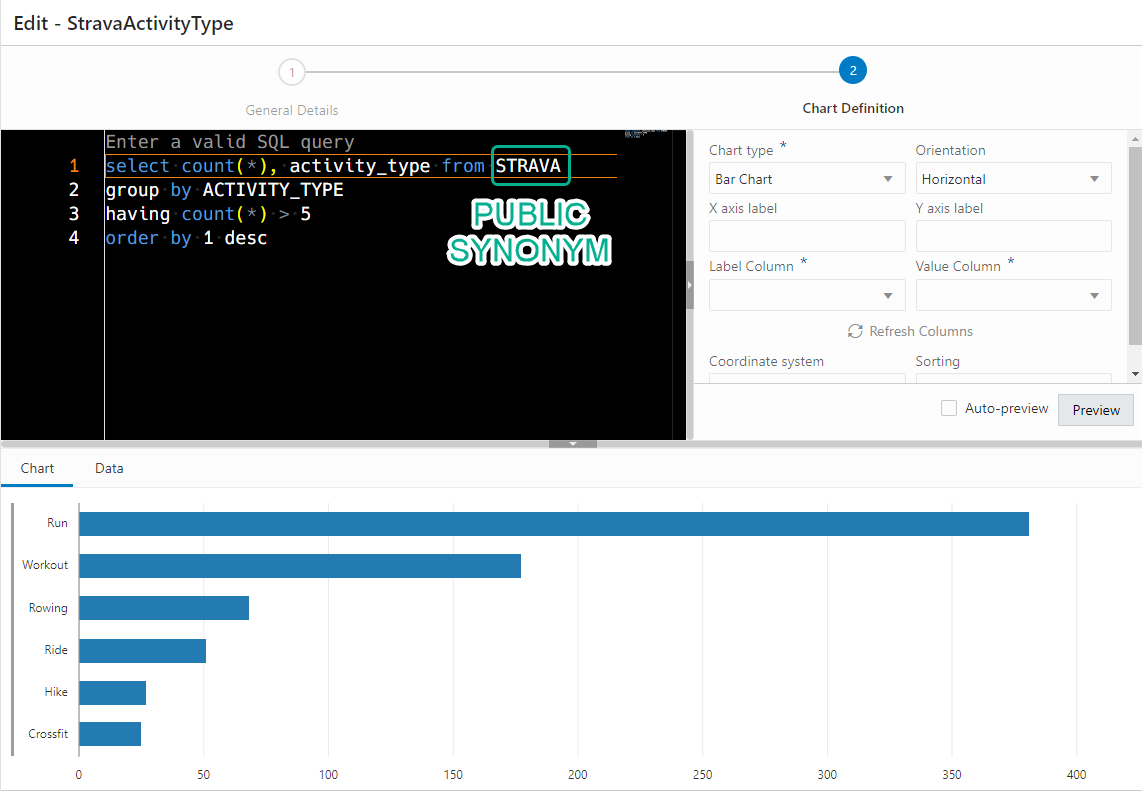
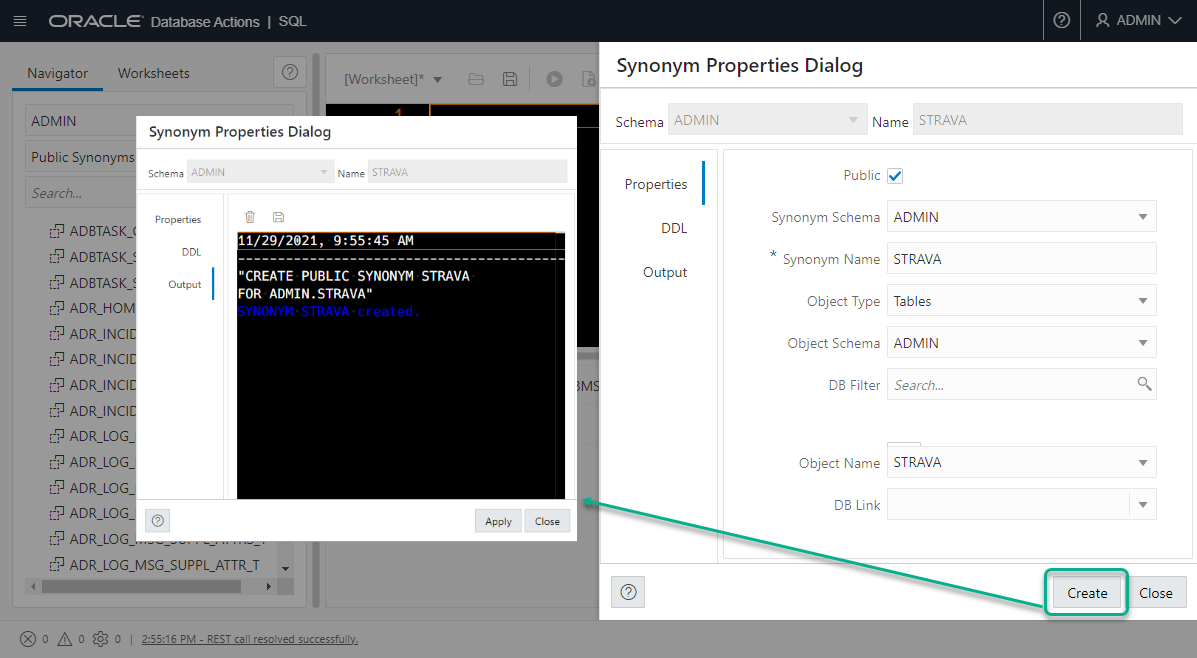
I’ve created a PUBLIC SYNONYM on DATA.CHARTS, to make defining my chart queries more convenient. And because I hate recalling this syntax from scratch, I’m using the SQL worksheet’s PUBLIC SYNONYM create dialog to do the work for me.
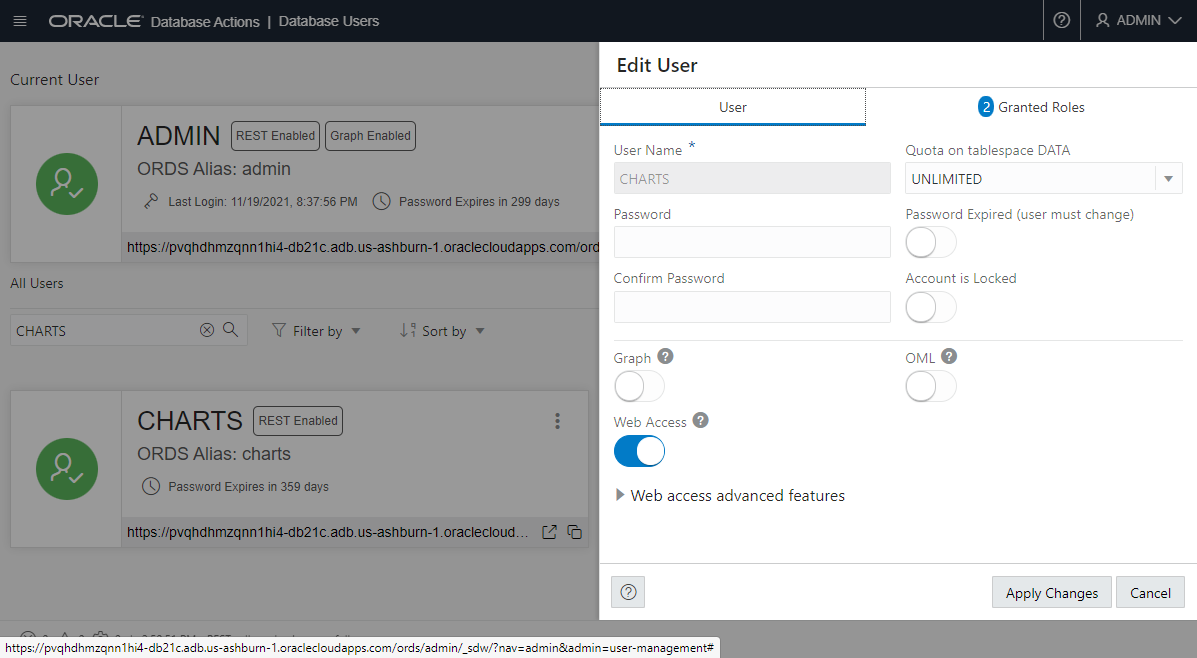
My CHARTS user was created with CONNECT, RESOURCE, REST ENABLED, and a solo READ GRANT on DATA.STRAVA. That’s it.
Bud Endress made one of these too –
Bud is our Product Manager (hero) for Analytic Views in the database. I’ve talked about these a bit before, but Bud’s went and made a dashboard that takes advantage of querying some AVs he’s created overtop some health data.
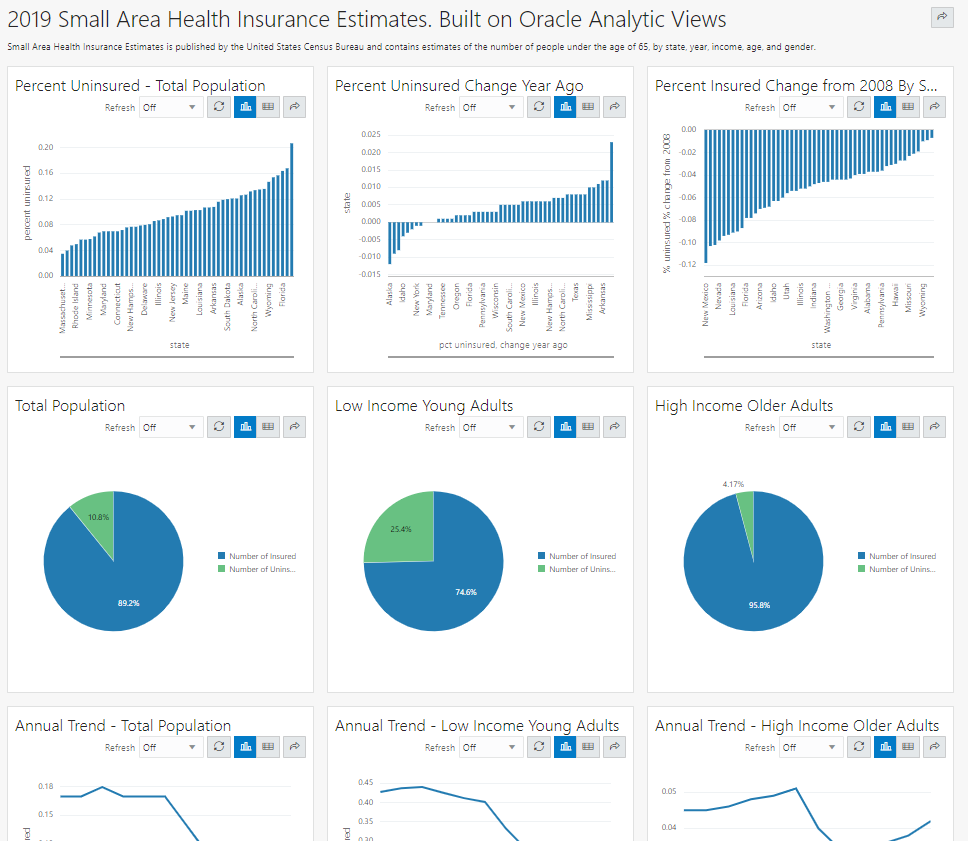
Bud’s SQL is pretty simple like mine, BUT his magic is the logic back-ended by the Analytic Views he’s created.
The SQL driving a chart looks like this:
SELECT
    d261_geography_hier.member_name   AS geography,
    pct_uninsured_chg_year_ago * 100
FROM
    d261_small_area_health_av HIERARCHIES (
        d261_year_hier,
        d261_geography_hier
    )
WHERE
    d261_year_hier.member_unique_name = '[YEAR].&[2019]'
    AND d261_geography_hier.parent_unique_name = '[ALL].[ALL]'
ORDER BY
    pct_uninsured_chg_year_ago ASC;
You can create your own Analytic Views as a ‘Business Model’ in SQL Developer Web if you’re using our Autonomous Database Services.
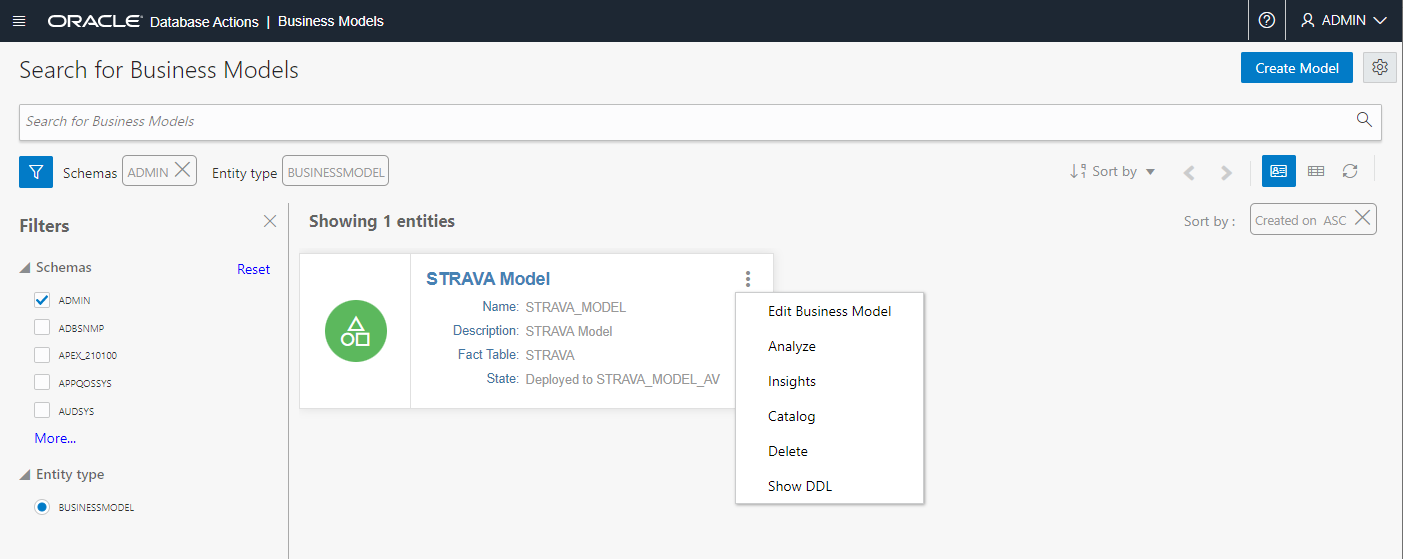
I’ve created one on my Strava Data in a few clicks/minutes, and now I can do all sorts of fun things, but that’s material for a future post 🙂


, and how to secure it!")