

Yesterday I shared a dashboard I published in my Always Free Autonomous Cloud Service.
The first question I got was:
I was just a little surprised that the examples in your blog weren’t live. After all, that’s the point of the feature.
A fan 🙂
So sure, let’s use the database itself to build some ‘live’ charts, or charts that have frequently changing data.
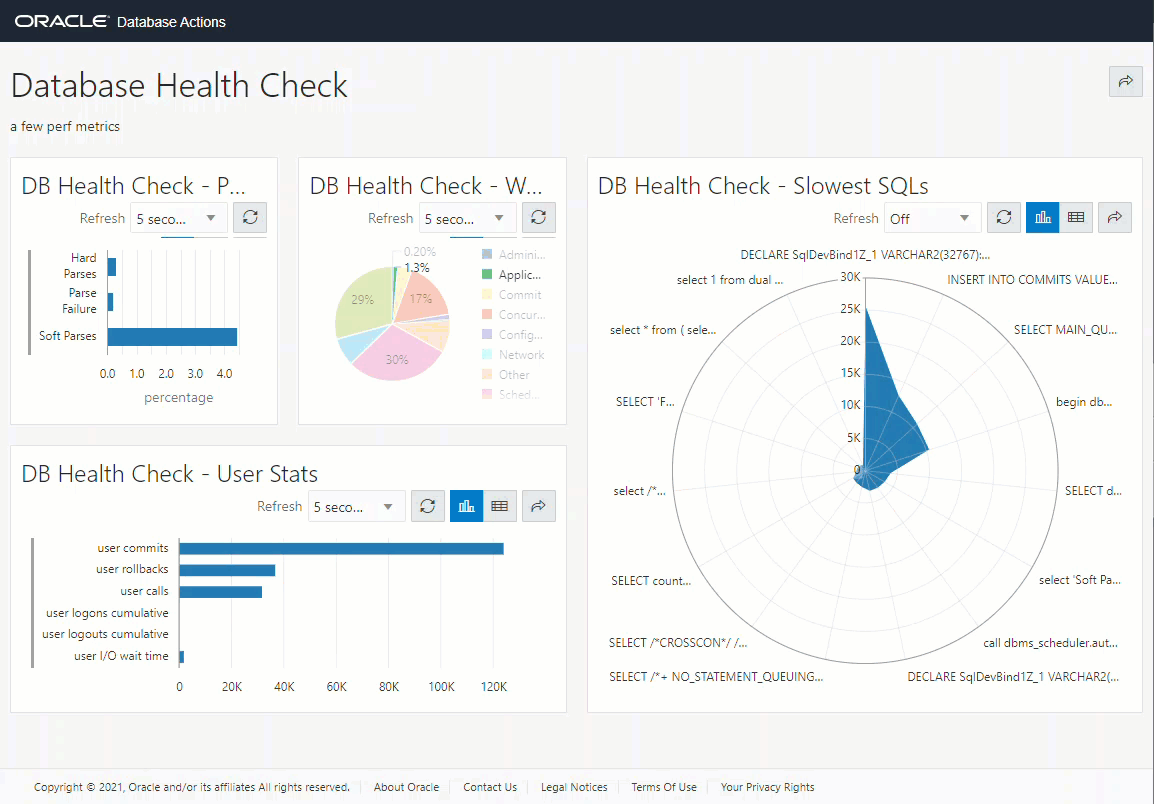
The Dashboard
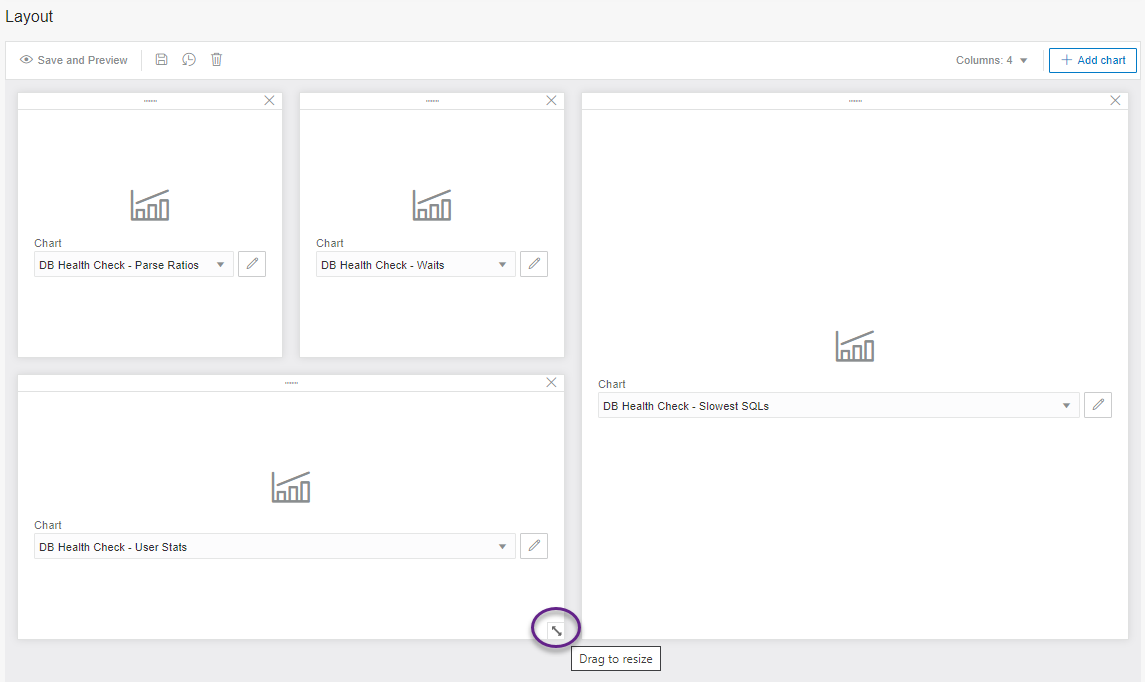
There are 4 actual charts. The layout is very much up to you. I wanted something wide enough that I could read the SQL text on my ‘Slowest SQL’ chart. And I needed similar to get true idea of scale on my User Stats – so both of those got the space that 2 charts would normally take. And my Health Check chart isn’t just two columns wide, it’s also two columns tall!
This is how that looks in ‘design-mode:’
The Reports
I picked some easier to get metrics out of some existing SQLDev reports. I know also back in the day that Tom was quite keen on knowing what your Hard/Soft parse ratios were. Please don’t take these as endorsements by me.
I am merely trying to demonstrate what you can do with the Charts feature, and using some data out of the data dictionary.
Waits
SELECT
    gv$system_event.wait_class             AS wait_class,
    0.6 * SUM(gv$system_event.time_waited) AS time_waited
FROM
    gv$system_event
WHERE
    wait_class != 'Idle'
GROUP BY
    gv$system_event.wait_class
ORDER BY
    1
Choose whichever type of chart you want, or adjust these queries as YOU see fit.
Slowest SQL
SELECT
    DISTINCT sql_text AS SQL,
    CASE
        WHEN cpu_time < 1000     THEN
            '< 1 ms'
        WHEN cpu_time < 1000000  THEN
            to_char(
                round(
                    cpu_time / 1000,
                    1
                )
            )
            || ' ms'
        WHEN cpu_time < 60000000 THEN
            to_char(
                round(
                    cpu_time / 1000000,
                    1
                )
            )
            || ' s'
        ELSE
            to_char(
                round(
                    cpu_time / 60000000,
                    1
                )
            )
            || ' m'
    END      AS cpu_seconds_form,
    cpu_time / 1000 AS cpu_mseconds,
    sql_id
FROM
    gv$sql
WHERE cpu_time <> 0
ORDER BY
    3 DESC
fetch FIRST 15 ROWS ONLY
I have (2) columns in the query used for the chart and the rest that come in handy if you switch to the grid view (cpu_seconds & sql_id).
User Stats
SELECT
    NAME,
    VALUE
FROM
    V$SYSSTAT
WHERE
        CLASS = 1
    AND ( NAME LIKE 'user %' )
Boring query, but interesting data?
Parse Ratios
SELECT 'Soft Parses ' "Ratio"
,round(
((SELECT SUM(VALUE) FROM v$sysstat WHERE name = 'parse count (total)')
- (SELECT SUM(VALUE) FROM v$sysstat WHERE name = 'parse count (hard)'))
/(SELECT SUM(VALUE) FROM v$sysstat WHERE name = 'execute count')
*100,2) "percentage"
FROM dual
UNION
SELECT 'Hard Parses ' "Ratio"
,round(
(SELECT SUM(VALUE) FROM v$sysstat WHERE name = 'parse count (hard)')
/(SELECT SUM(VALUE) FROM v$sysstat WHERE name = 'execute count')
*100,2) "percentage"
FROM dual
UNION
SELECT 'Parse Failure ' "Ratio"
,round(
(SELECT SUM(VALUE) FROM v$sysstat WHERE name = 'parse count (failures)')
/(SELECT SUM(VALUE) FROM v$sysstat WHERE name = 'parse count (total)')
*100,2) "percentage"
FROM dual
That last query courtesy of dilipdba.
To create these charts, you can copy and paste the SQL in, and then go from there. Enjoy!


5 Comments
Well say we have diff client data in the table CLIENT_SALES with a CLIENT_CODE column that defines the data for each client then we have a USERS table with USER_ID and CLIENT_CODE
So in order that the dashboard only displays data for user logged in we would have
SELECT sum(cs.sales_total)
from CLIENT_SALES cs,USERS u
where u.client_code = cs.client_code
and upper(u.user_id) = :APP_USER
I’ve tried various links with logins on the underlying tables but still stuck 🙁
‘Various things’ … like, what?
These are great !
is there anyway we can link them to the current logged in user on APEX the :APP_USER ??
How do you mean, ‘link?’