I have a 4000 and so lines SQL script that I keep on hand to setup a test table that I can write REST APIs and build charts off of.
It’s my Strava workout/exercise data.
In Database Actions, formerly known as SQL Developer Web, powered by ORDS, we don’t support the concept of ‘opening’ or ‘saving’ files yet. If you create a file via exporting a query result set, you get it as a file download.
However, that doesn’t mean you can’t save and re-use your work!
By the way, true file management is a project underway, we are working on getting you this feature!
In the meantime, you CAN save and recall your worksheets.
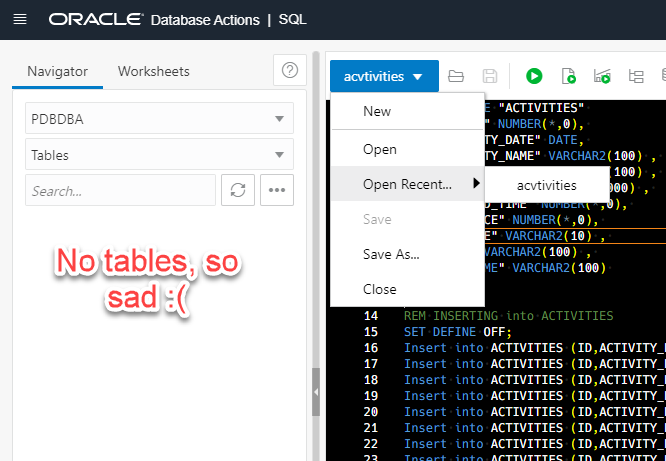
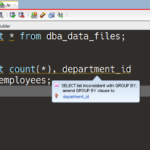
Whatever text I have in the SQL page, I can hit the ‘Save’ button. Give it a name, in this case ‘activities.’ Then I can use the Open or Open Recent item to recall it.
But, where is it being stored, in my Database?
Nope! The database is being recreated every night, so that would be lost.
It’s being stored in your browser!
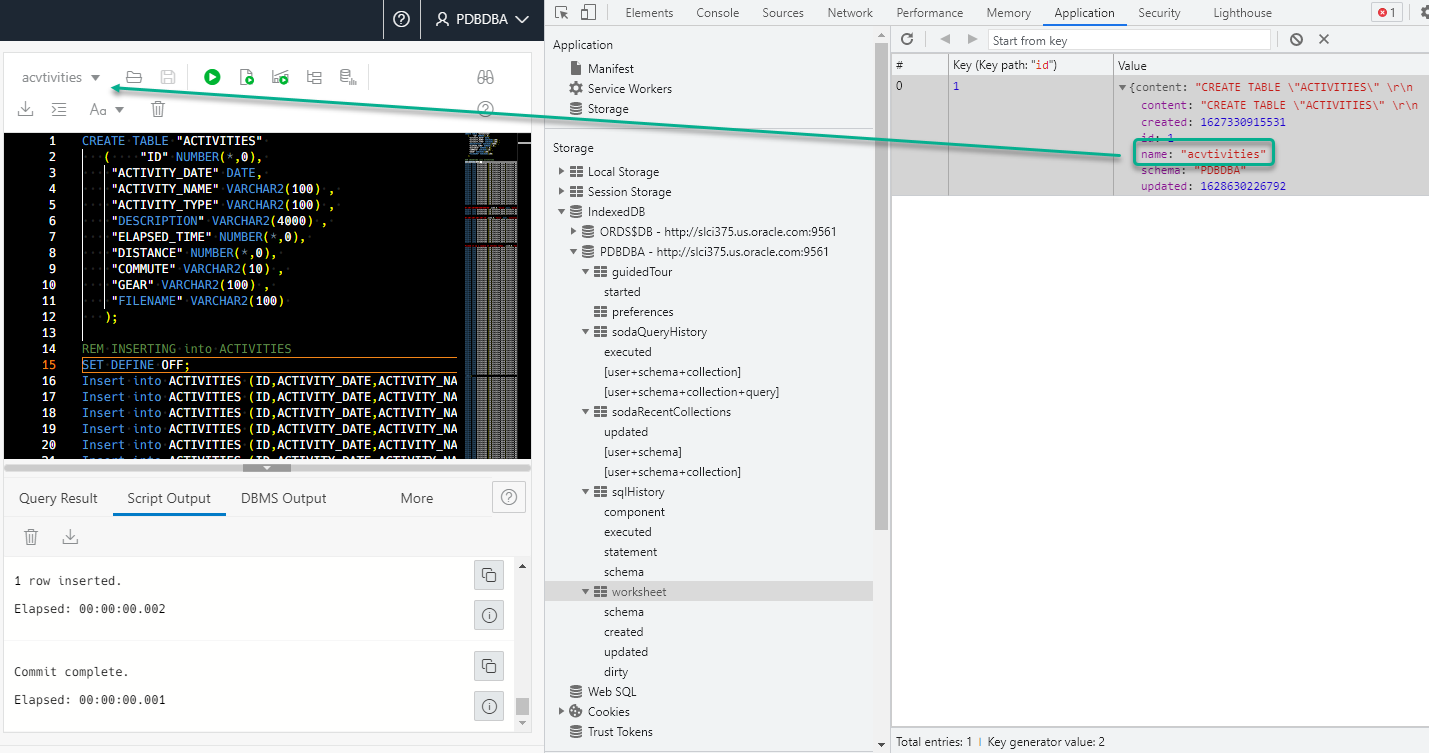
Your SQL History, application preferences, and these worksheets are stored here. The only thing we maintain in the database itself right now are your Data Model Diagrams.
Now, since it’s being saved in my browser, and is being organized by the URL (database) from which it serves, it means if I switch machines, browsers, or even databases, I’m not going to see these items.
We are looking at saving this kind of stuff IN the database optionally so your work would persist across workstations and devices.
And we’re also working on actual Git integration in the Oracle Cloud, so you can do proper versioning and source control of your important stuff. Stay tuned on all these fronts.
My data is back!
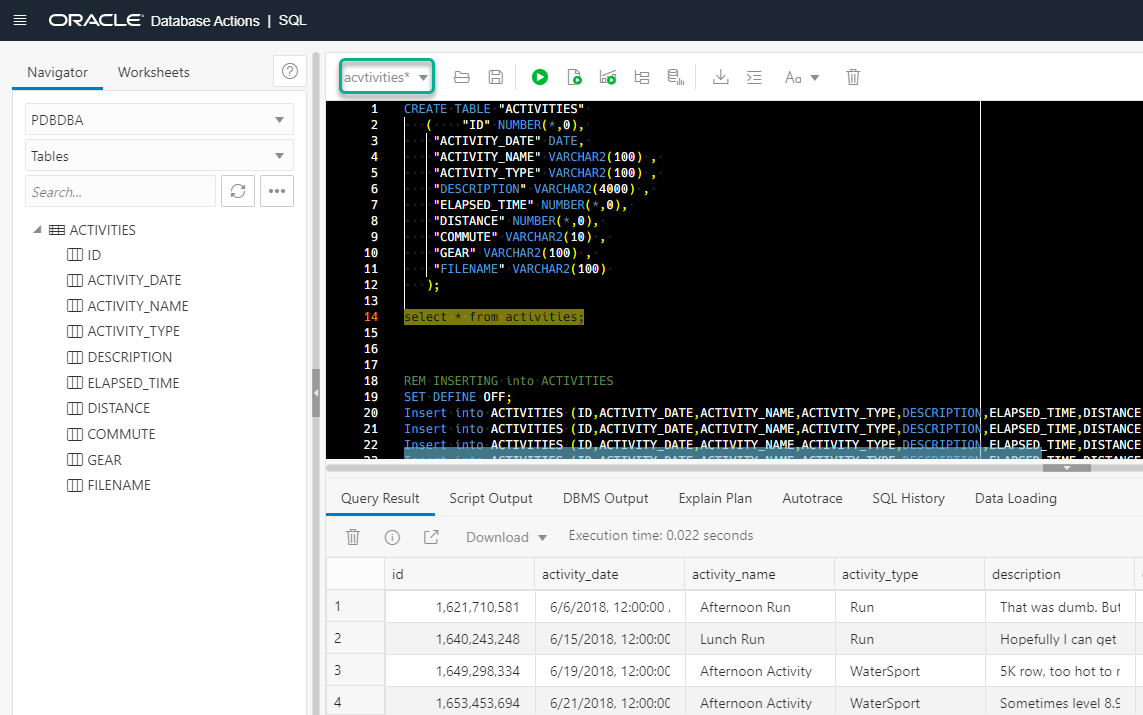
So I have my table and my data back, now I can do cool things, like play with the charts.
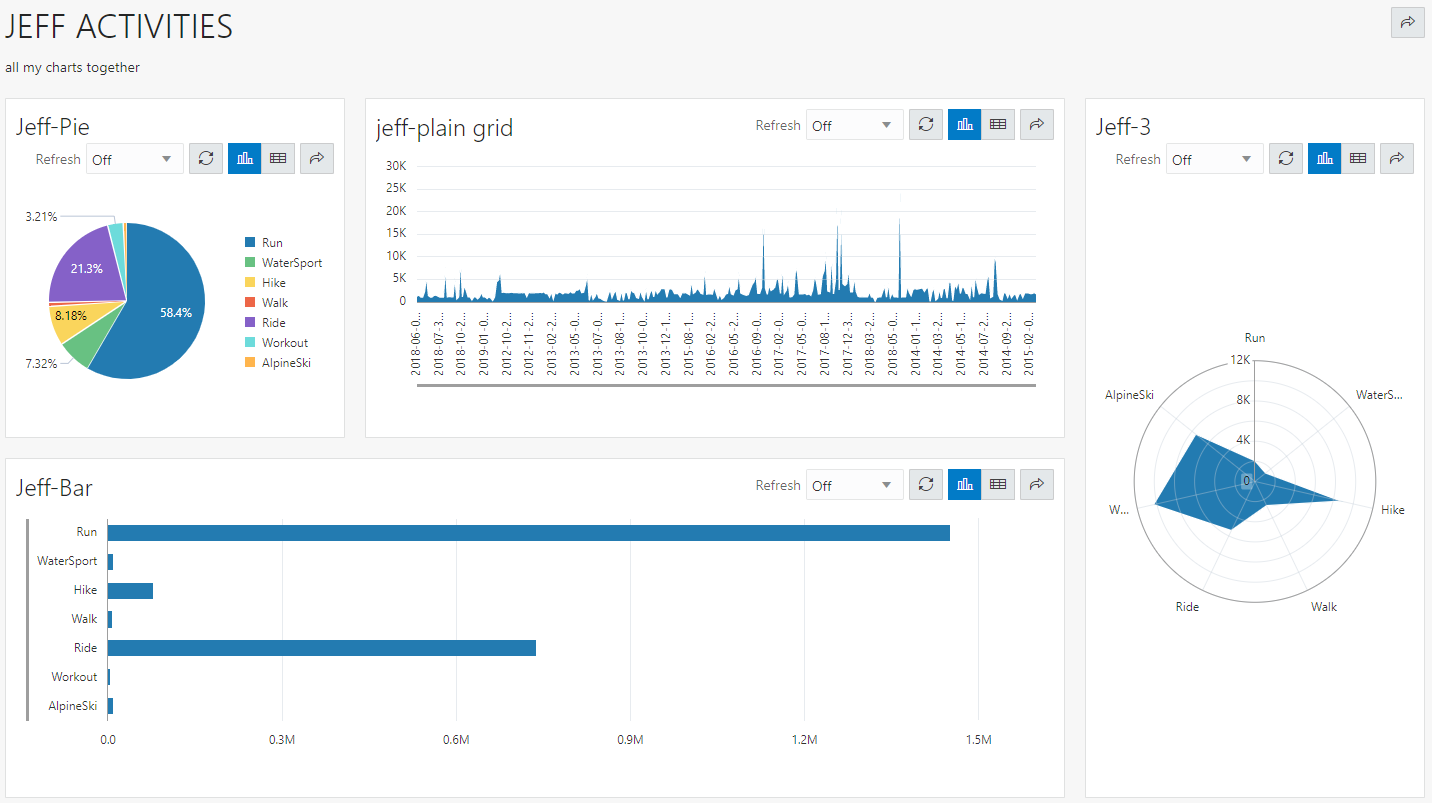
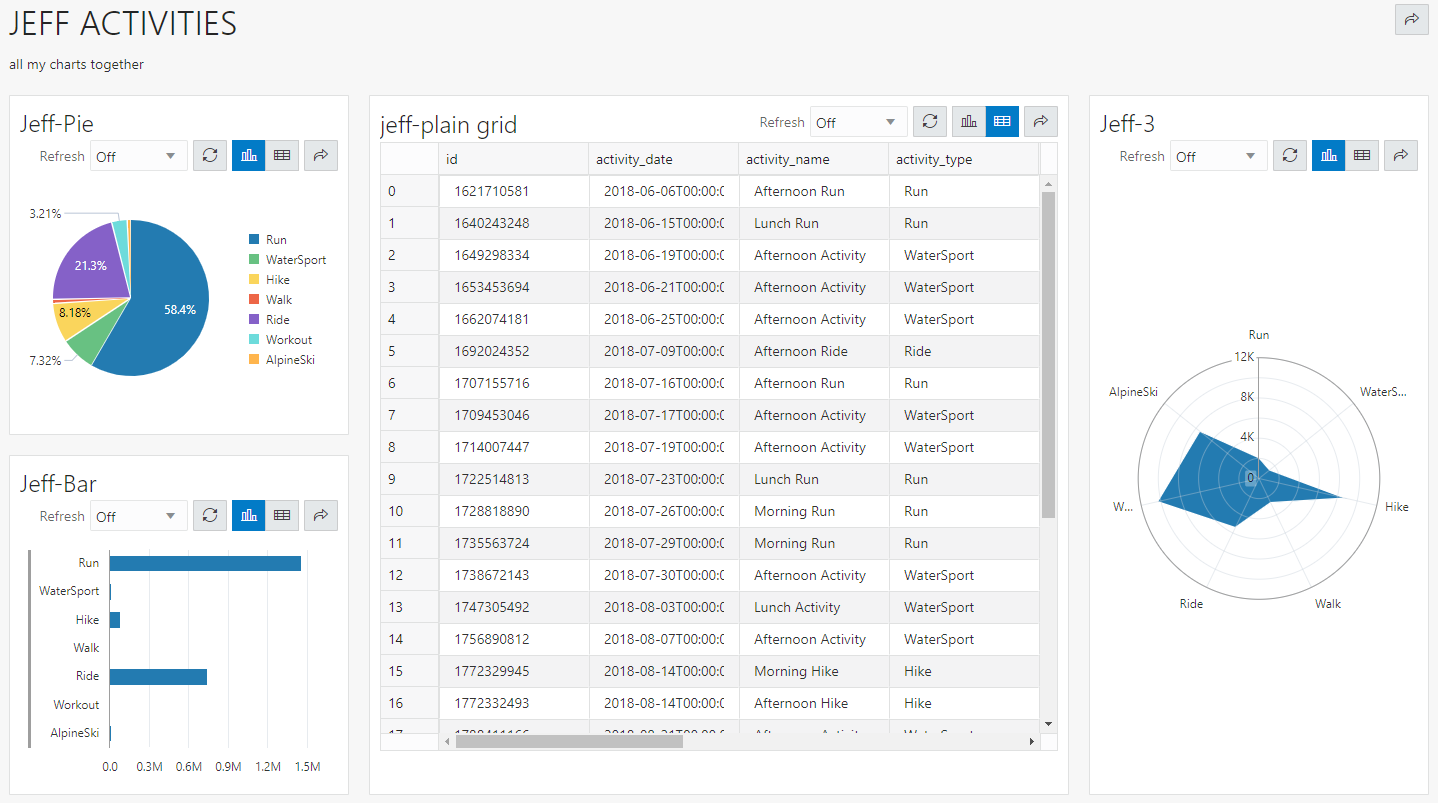
Charts, you remember we built a charts feature?
In the last update, we introduced the ability to create a chart, based on the results of a valid SQL query. You can get caught up on that here.
The end goal for this feature was being able to tie a bunch of charts TOGETHER, so you could create dashboards of interesting data. The data refreshes, is protected/backed by REST APIs, and can be used across different applications. And the charts are brought to you by Oracle JET.
It’s early, but I’m feeling tempted to show you what’s coming in the next update.
Ok, here’s a sneak preview of a charting feature we’re going to drop in the next major update, Dashboards 🙂
Sneak Peek 1:
Sneak Peek 2: