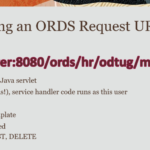
One of the base features of Oracle SQL Developer Web is the Performance Hub. This performance diagnostics feature might be familiar to you if you have ever used EM Express.
You’ll have also seen this in our Autonomous Database Cloud Services, and I’ve talked about that before.
Blog: Perf Hub in Oracle Autonomous Database
Video (25 minutes): Perf Hub tour in Autonomous
Where is it?
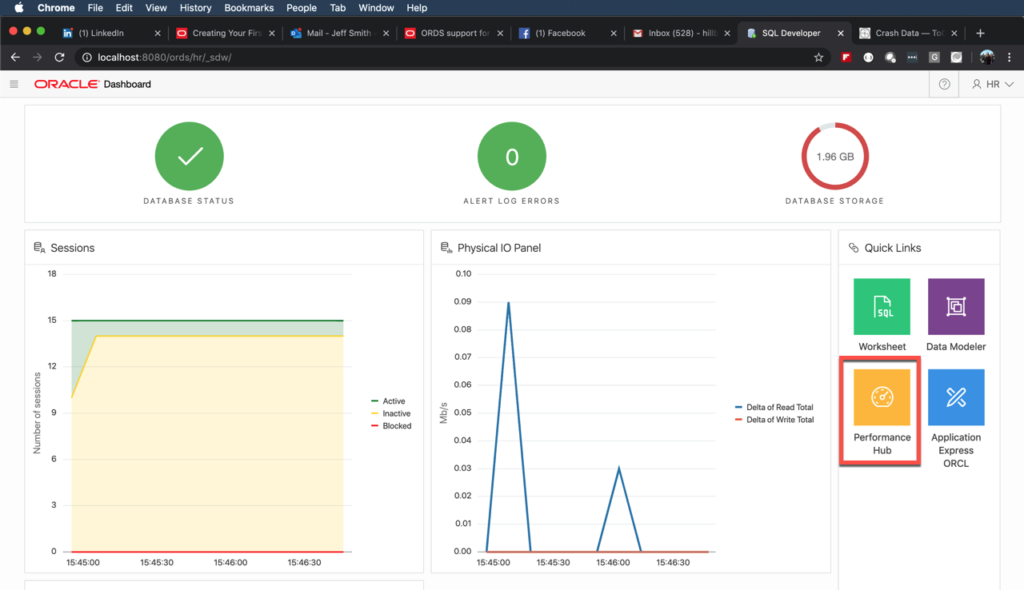
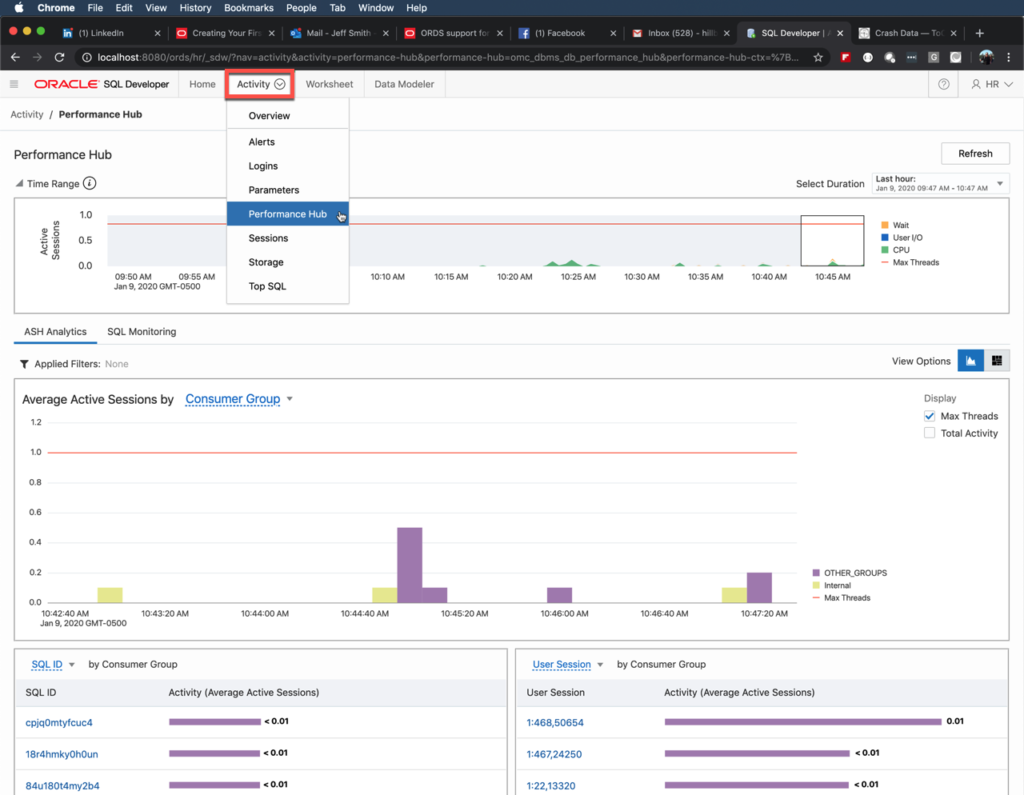
If you have a DBA level user account (and of course if you have licensed the Diagnostic and Tuning Packs), you can use PerfHub and the Real Time SQL Monitoring inside it via SQL Developer Web.
There are two user interface entry points for the Performance Hub. When you start a SQL Developer Web session as a DBA privileged user, you’ll see a box for it on the right.
Or, if I’m tooling around in the Worksheet, and I want help with a query…
Powered by ORDS and JET
The EM team built this feature using Oracle JET and ORDS. So it was VERY easy for us to drop it right into SQL Developer Web.
That means you’re seeing the same data/features/presentation as you’d see it anywhere else the EM team is delivering this information.
A quick GIF demo of the SQL Monitor