Our serverless offerings for Oracle Autonomous Database, Data Warehouse and Transaction Processing launched a new feature this week, the Performance Hub.
This gives you a nice (non-flash!) interface with Real Time SQL Monitoring and Active Session History performance reporting.
I gave an overview of this yesterday complete with demonstration in an Office Hours session. In case you missed it, here’s the video:
If you want to jump to the demonstration, that’s here (7:35).
For those of you who can’t get to YouTube…
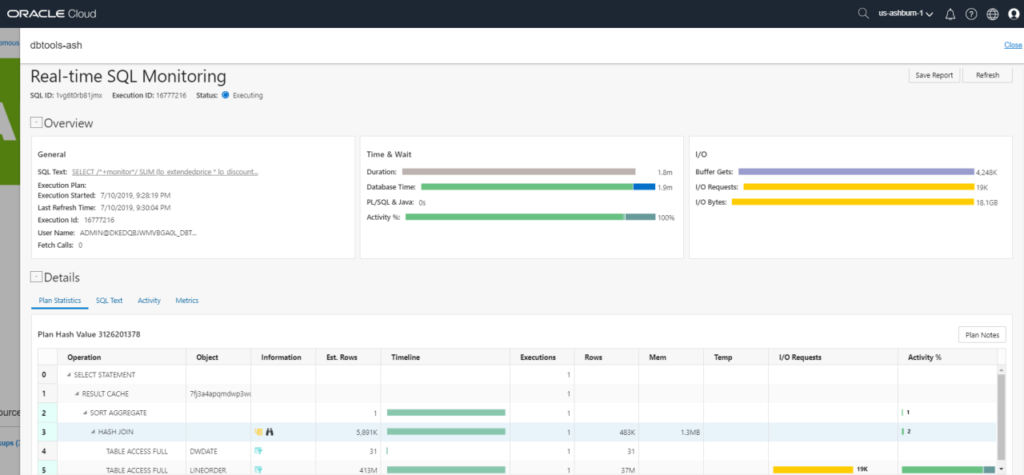
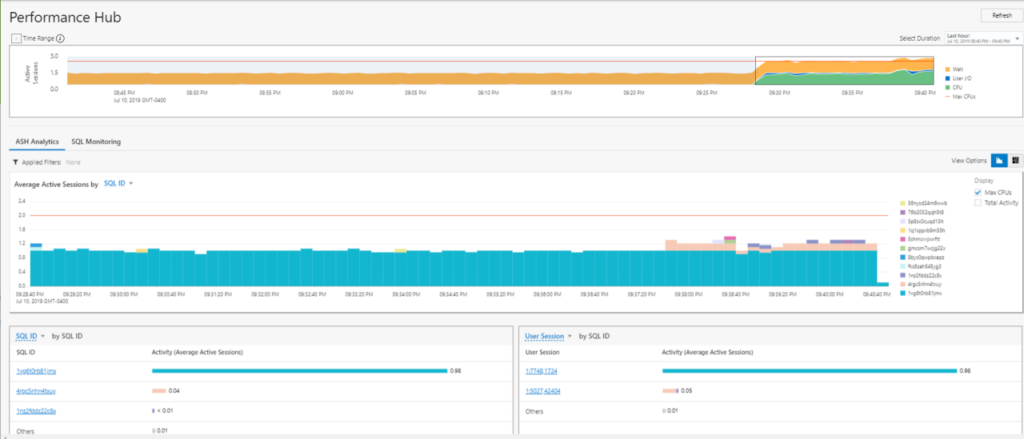
Here’s an overview of the feature.
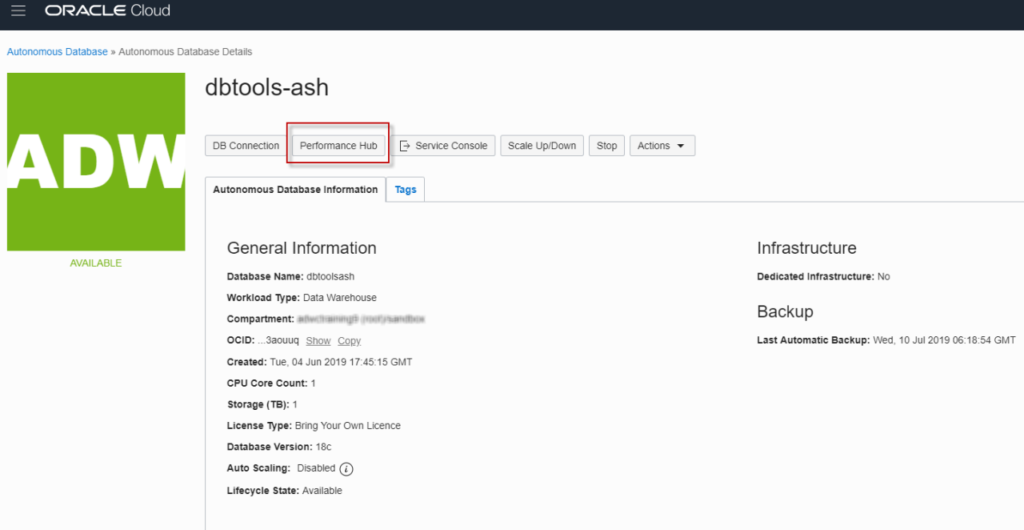
Clicks the button…
Let’s jump straight into the SQL Monitoring bit…
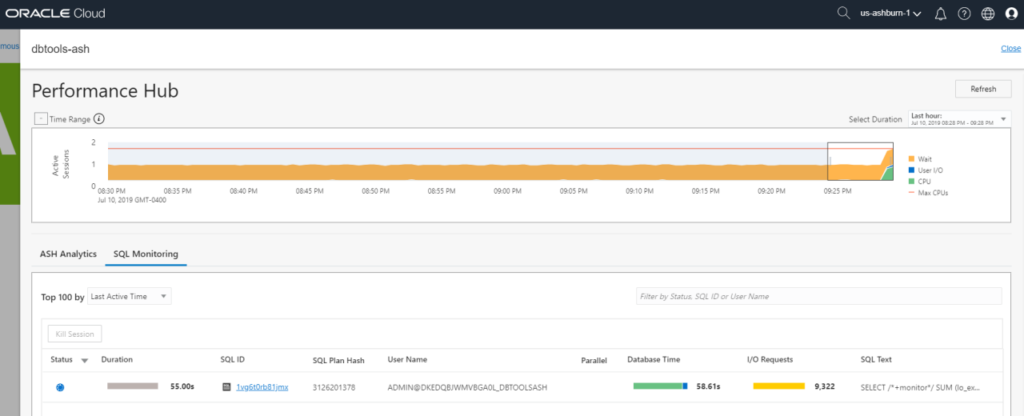
Clicking on the SQL ID will open the report…
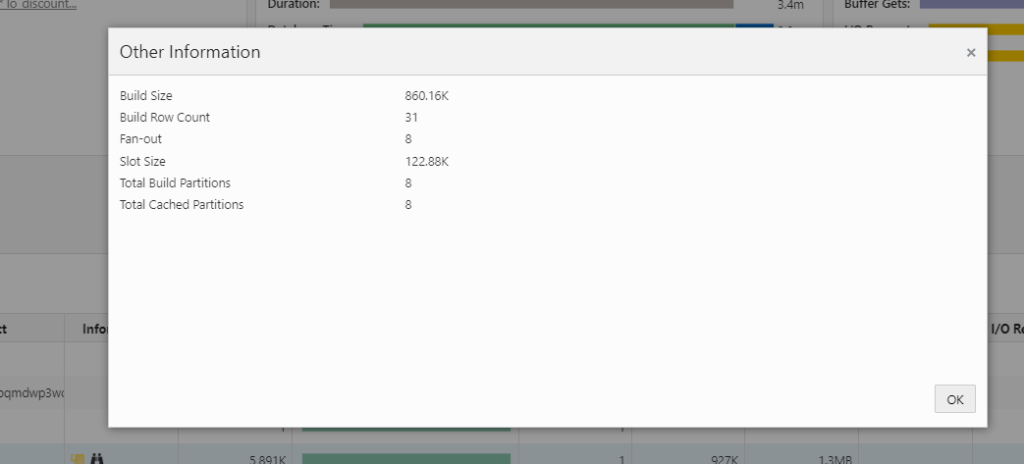
You can open the plan notes or click on the predicate indicators or the binoculars for ‘more info’ on a plan step:
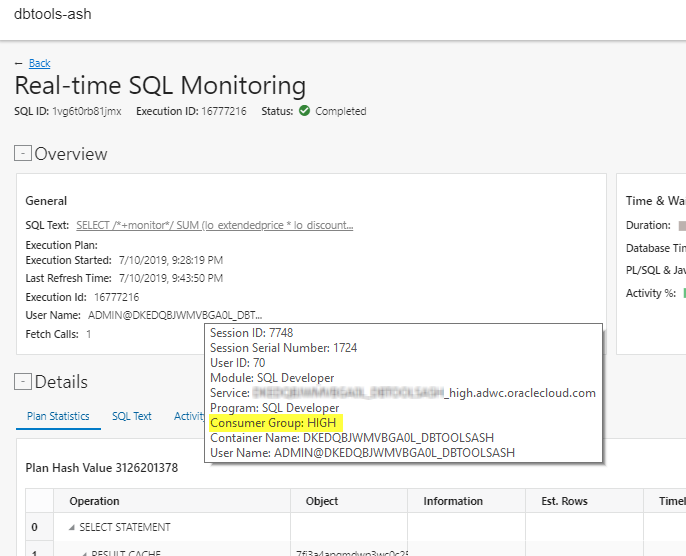
If you’re curious about which Resource Consumer group is in play, or who ran this, from what module, hover over the User Name text:
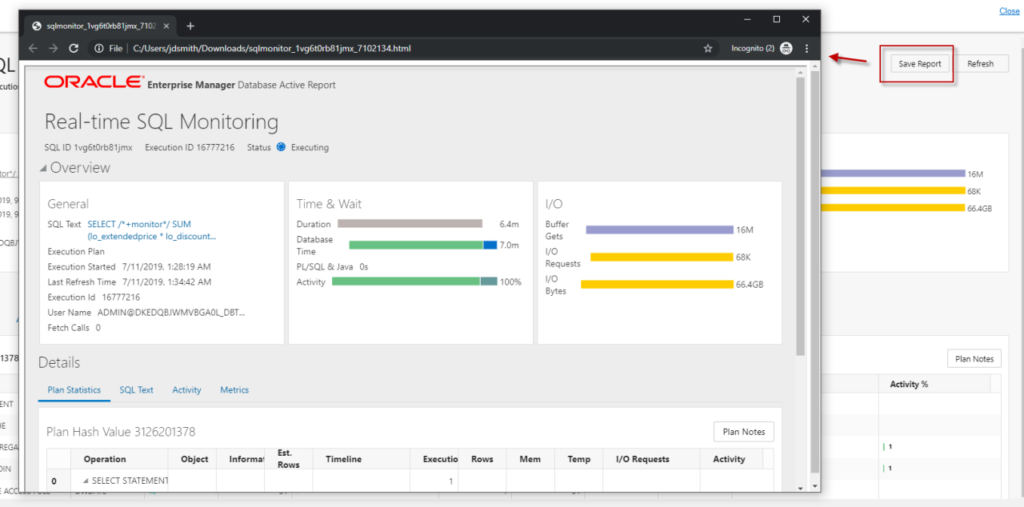
Need to save the report with someone else? Someone who does NOT have access to your Service Console, or even a database credential/account?
No problem…
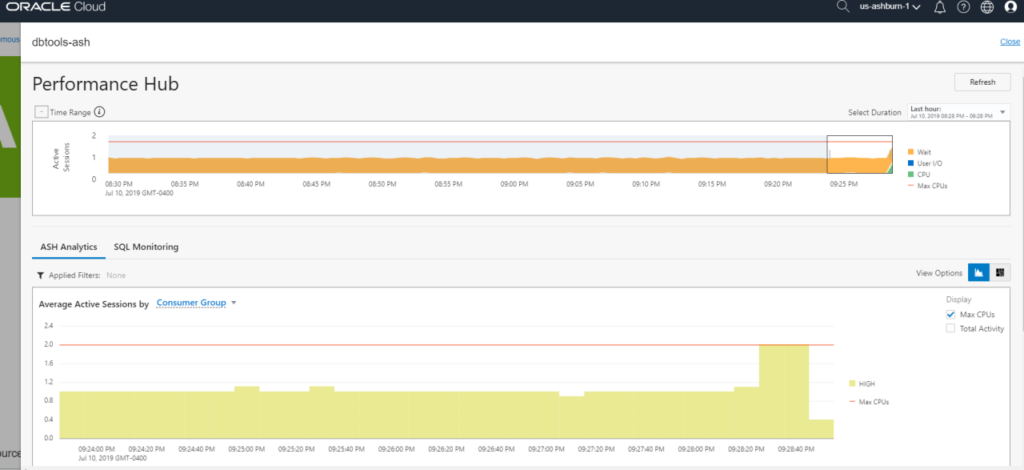
Wait, what about that ASH stuff?
Need even more POWER? Don’t forget that Auto Scaling (Docs) is now available for your service. As the workload increases, so does the CPU available to run the query.