
Starting the debugger CAN be as simple as hitting this button in Oracle SQL Developer:

But
But, you need to make sure of the following:
- You have compiled for debug
- You have the privs
- You have a breakpoint set OR you have set the debugger preferences to start with a ‘Step Over’
- On Database 12c, you’ve done setup the network access control list
That’s a lot of buts. Let’s plow through them!
Wait, wait, wait. Before you do anything else: start SQL Developer, connect to your database, and load your PL/SQL object into the Procedure Editor (not the worksheet!)
Ok, now we can start.
Compile for Debug
Don’t do this in production – it adds overhead for working with and executing the PL/SQL. But you really need to do it in the development instance if you want to debug. It’s the default ‘compile’ operation in SQL Developer. We assume you want to DEBUG with the IDE. But if you want to be explicit, do this:
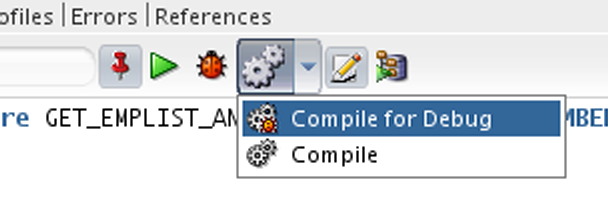
Doing this will allow for things like watches and breakpoints to work. Without those, debugging is kind of boring.
You have the privs.
You need EXECUTE on the object and DEBUG CONNECT SESSION.
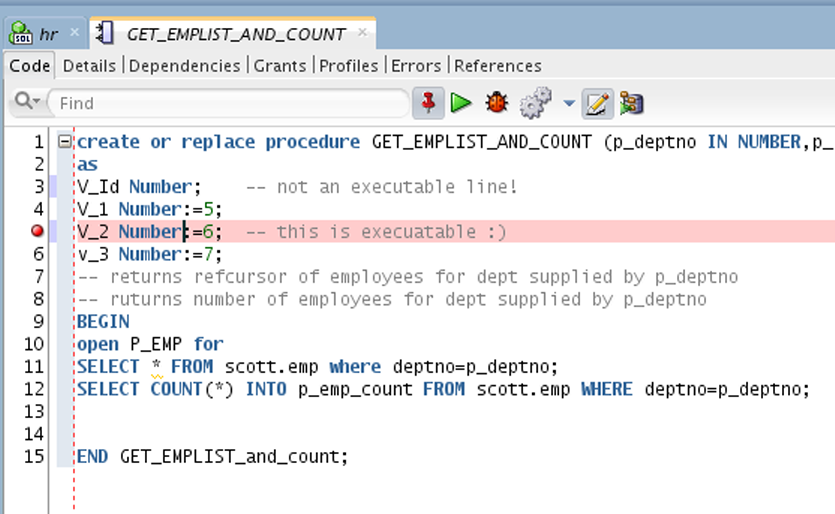
Set a breakpoint.
Find an executable line of code. Not a comment. Not a declaration (unless it’s also an assignment.) Now click in the gutter space.
Wait, I don’t want a breakpoint!
Ok, open the preferences and set your debugger to do this:
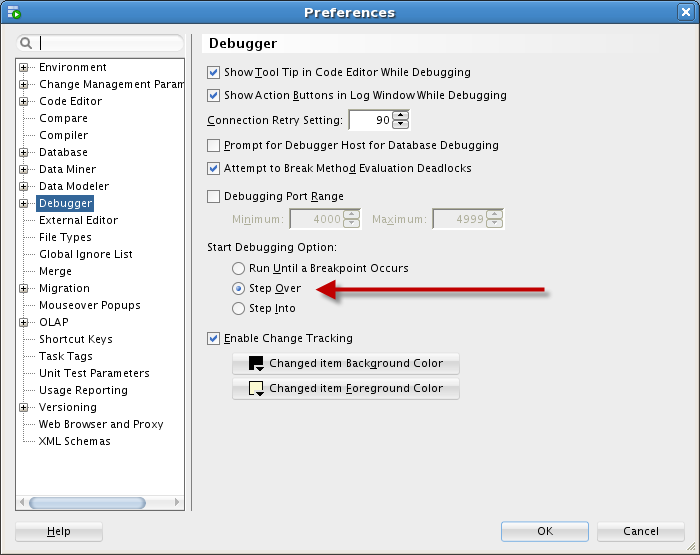
With it set to ‘Step Over,’ the debugger will stop on Line 1. From there, the debug session is up to you. If you have it set to ‘Run Until Breakpoint Occurs,’ then the procedure will run until it finds a reason NOT to run. Without exceptions or breakpoints, you’ll just see the debugger log say, ‘Finished’ – and that’s no fun.
So set a breakpoint, or don’t set a breakpoint – but make sure the debugger is set to do what you want it to.
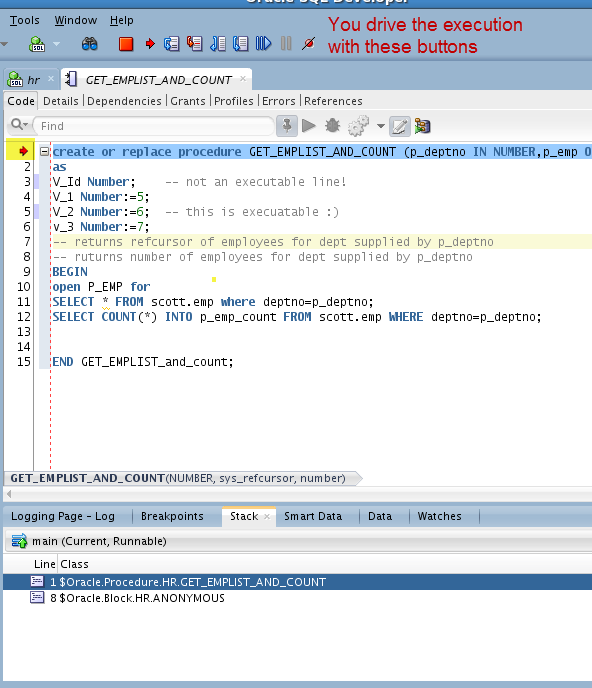
And Now You’re Cooking With Gas
Ok, NOW hit the debug button.
You’ll get prompted for the inputs in the anonymous block popup editor. Hit OK, and you’re debugging.
One More Thing…Database 12c
There’s an extra security level in 12c. To get access to JDWP, you need to make it available to your users. Friend of the community Galo Balda wrote this just the other day.
This may be my last post on the debugger, but I doubt it.


57 Comments
Where I work, it is not possible to have a hole punched through the firewall from the server to my PC. I tried using the suggestions about modifying the sqldeveloper.conf and ide.conf files, but the DBMS_DEBUG_JDWP.CONNECT_TCP procedure is still being executed. I am using SQL Developer 19.2. Any other suggestions on how to make the debugger work like it used to? I would very much like to fully transition from TOAD to SQL Developer and this is one of the last hurtles to get past.
Just catching up on emails after being out a few days, and I actually just responded to you there. But for those reading it here, try adding it to the product.conf or ide.conf files. If you see the JDWP call in the error, it means the old debugger isn’t being used.
Dear Jeff,
I’m a long time reader, first-time poster.
I have a weirdy beardy here. When debugging my first procedure my PL/SQL block is blank. All others seem to contain the debugging SQL. Any ideas?
Robot
You mean the first time you do a debug session?
Executing PL/SQL: ALTER SESSION SET PLSQL_DEBUG=TRUE
Executing PL/SQL: CALL DBMS_DEBUG_JDWP.CONNECT_TCP( ‘10.39.37.152’, ‘4000’ )
ORA-30683: failure establishing connection to debugger
ORA-12535: TNS:operation timed out
ORA-06512: at “SYS.DBMS_DEBUG_JDWP”, line 68
ORA-06512: at line 1
I’m not able to debug. Please help me.
Thank You..
Firewall?
I am getting the same problem, Any fix?
Yeah, make sure the db server can reach your machine’s IP on the network.
on which port?
It picks a random port on your machine, unless you specify one or a range in the debugger preferences
Hallo…
i have an interessting debugging problem…
connectiontype = TNS ( DB1 ) it works fine, debugger works perfekt, CONNECT_TCP is the right ip-adress
then i change my config…
connectiontyp=advanced and URL = jdbc:oracle:oci:/@DB1 ( it is the same like TNS-Connection ) … the debugger dosen’t work… CONNECT_TCP is a wrong ip-adress ( 127.0.0.1 )
normal working is ok… but no debugging 🙁
i have no idea, where the problem is… can you help me?
best regards
tino
Why are you using an advanced/jdbc URL connection?
How can you use the debugger for sqldeveloper to debug oracle objects (stored procedures, packages, etc) when the database is hosted on a remote server without opening ports 40000-49000. The dba is reluctant to create the acls required or open the ports due to security issues.
You can tell SQLDev to use the old, deprecated debugger that goes more client->server vs server->client
edit the sqldeveloper.conf and add this line
AddVMOption -DDatabaseDebuggerDisableJDWP=true
It won’t offer the fancier features, like automatic support watching complex things like plsql tables. But it will let you step through your code.
Solved as follows
I created a tunnel with reverse option on the host:
ssh -pPORT_FOR_ACCESS -R 4000:127.0.0.1:4000 root@(VM_IP)
Port 4000 and IP 127.0.0.1 should be fixed in SQLDEVELOPER parameters;
I added AddVMOption -DDatabaseDebuggerDisableJDWP=true to the sqldeveloper.conf and restarted. However nothing changed.
Connecting to the database db_user.
Executing PL/SQL: CALL DBMS_DEBUG_JDWP.CONNECT_TCP( ‘10.46.242.112’, ‘49275’ )
ORA-30683: failure establishing connection to debugger
ORA-12535: TNS:operation timed out
ORA-06512: at “SYS.DBMS_DEBUG_JDWP”, line 68
ORA-06512: at line 1
Process exited.
Disconnecting from the database db_user.
With security being what it is these days, requiring more open ports seem like a bad idea.
this should only be happening on a development instance, and if you’re asking me, each developer should have a private sandbox on their machine to work with
this being the real world though, i realize that’s not happening as much as I want it to
you need to add that to the TOP of the ide.conf file
“It’s the default ‘compile’ operation in SQL Developer.”
It would be nice if that was an option in preferences or even in the connection settings (per database). ie, PROD default DEBUG=no; TEST default DEBUG=yes. I’m not saying to disable it all together, just have a default setting that each user can control.
I’m running XE on my local machine and would like to debug a function in a package. Somehow the debugger process is not starting after I’ve compiled the package and body for debug; however, the debug listener starts, and I can then manually execute the following statements in an SQL worksheet for the connection:
ALTER SESSION SET PLSQL_DEBUG=TRUE;
CALL DBMS_DEBUG_JDWP.CONNECT_TCP( ‘127.0.0.1’, ‘4000’ );
which produces this success message:
Debugger accepted connection from database on port 4000.
But thereafter I can’t step through the code – the Step Into, Step Over etc. buttons are greyed out, and irrespective of my debugger options settings (Run until a breakpoint occurs, Step over) no statement pointer appears. I wonder what is missing?
What do you see in the debug log panel below when you start a debug session using GUI debug buttons?
Hi Jeff, thank you for your reply. I don’t see anything. The panel appears, but no commands are issued in it – it’s empty. At the lower right the status area tells me I am ‘Launching – Starting target’, but apparently nothing gets launched; the .jpr process apparently doesn’t start. If I press the GUI debug button again, I am prompted to enter another port (since the initial port, 4000, is already being listened on), and after doing that I get another row in the lower-right stack of ‘Launching – Starting target’ bar indicators. I can keep doing this and get several bars stacked up at the lower right, but the window for the debugging process that shows me the plsql source, breakpoints and everything doesn’t appear. (But the IDE does not freeze up.) In the Processes tree at the left, no debugging process is shown – just the “Debug Listener” process.
Hi again Jeff, I haven’t been able to get the debugger to run the normal way, but the following steps allow me to debug. I wonder if this helps to diagnose the cause of the problem? Also, do you know whether Java outputs any log messages that I could look at while trying to invoke the debugger the normal way that might give a hint about the cause?
1. Set the ‘Start Debugging Option’ to ‘Run Until a breakpoint occurs’.
2. Open an SQL worksheet on the desired connection.
3. Execute the following within that SQL worksheet:
ALTER SESSION SET PLSQL_DEBUG=TRUE;
4. Open the package body containing the routine(s) to be debugged and, after compiling for debugging, press the GUI “Debug…” button. Prepare the anonymous block with the desired parameters, copy the block onto the clipboard, and press OK; the Processes tree panel on the left then shows that a process is listening on port 4000.
5. In the package body that was opened, set a breakpoint in the routine to be debugged.
6. Execute the following statement within the SQL worksheet that was opened:
CALL DBMS_DEBUG_JDWP.CONNECT_TCP( ‘127.0.0.1’, ‘4000’ );
7. Paste the anonymous block that was copied above in step 4 into the SQL worksheet and run it. (If a message pops up beforehand about using the package version on the database instead of the displayed one, press ‘OK’.) The debugger should run and stop at the breakpoint.
I would be grateful for any suggestions you may have. Also I wonder what you were doing at the Montgomery Regional Airport a few years ago? I grew up close by and am always surprised if anyone arrives there other than by accident 🙂
Hi Jeff, I discovered a solution to my debugging problems. This tip may help someone else, so here it is: I removed the “SQL Developer” folder from C:\Users\\AppData\Roaming\ (on Windows 8.1). When I then restarted SQL Developer, it rebuilt the folder; I had to define my connections again and set my preferences, but the debugger now works completely normally. I’m well chuffed!
try to set your port as its configured on db server listener. 1521 as default is enabled to ping back your db.
the debugger port has NO correlation to the database listener
it’s the port on your PC that the database will attempt to make a connection to start the debug session
I face a very strange problem. When I am trying to start local debugging by pressing the bug-button, then at processes panel, it appears the debug listener (with port 8080) and I cannot proceed with debugging. Debug listener does not swift to the local debug icon (the red bug). Any idea where to look?
thanks
Hi Jeff,
how do I have to configure SQL Developer to debug a remote database via a tunnel? How do I have to configure the tunnel? Unfortunately I receive
PL/SQL wird ausgeführt: ALTER SESSION SET PLSQL_DEBUG=TRUE
PL/SQL wird ausgeführt: CALL DBMS_DEBUG_JDWP.CONNECT_TCP( ‘127.0.0.1’, ‘63062’ )
ORA-30683: Fehler beim Herstellen von Verbindung zu Debugger
ORA-12541: TNS: Kein Listener
ORA-06512: in “SYS.DBMS_DEBUG_JDWP”, Zeile 68
ORA-06512: in Zeile 1
Prozess beendet.
In normal run mode everything works fine…
Best regards
Matthias
Sorry, please ignore my post. I haven’t read all the other posts before…
Thanks. Nice one.
Hello, I resolved this problem, only give a permissions on my Firewall. We need to give permission from Data Base (server) to see a segment network on my company. My case of problem, when a user want to debug, the data base server not see my client my machine (My IP) so, we need to give a permission on my Firewall and that’s it.
Mr. Rodriguez,
I understand that there may be a language barrior in you communications but, could you please try to describe what you did to resolve the debugger connection problem?
What permissions were given on your firewall?
Thanks for your time and patience.
IsleOracle
Weird problem on SQLDEVLEOPER v 4.0.2.15. When I fire off the debugger most of the time on this largish package I am working on, it pops another tab with the same package body, and breaks on the last line of the package body. I have not seen this behavior in v3.x
Any thoughts?
Yes, actually 🙂
18923305 DEBUGGING PACKAGE BODY MEMBER OPENS EXTRA COPY OF PROGRAM FOR DEBUGGING – that’s a bug fix available in v4.0.3 of SQL Developer. Available as of just last week.
Executing PL/SQL: ALTER SESSION SET PLSQL_DEBUG=TRUE
Executing PL/SQL: CALL DBMS_DEBUG_JDWP.CONNECT_TCP( ’192.168.250.36′, ’55640′ )
ORA-30683: failure establishing connection to debugger
ORA-12541: TNS:no listener
ORA-06512: at “SYS.DBMS_DEBUG_JDWP”, line 68
ORA-06512: at line 1
Process exited.
Disabled the windows firewall & tried but same error persists now the connecting port has changed can we force sql dev to connect of the fixed port like 4000 ?.
Thanks
Based on my experience with SQL Developer, you can set the port by going to Tools > Preferences > Debugger >
Debugging Port Range – set the minimum and maximum to 4000.
That should set the fixed value.
SQL Dev requires port 4000 to be open to start the debug session.I can ask the security admin to open the 4000 port but can’t ask the security admin to open the ports random ports like 55640 considering the security concern.
Can we force sql dev to use the specified port only like 4000 on sql dev version 4 ? If not then what would be the other work around.
Thanks
Jeff,
Can you please help ?.
Thanks
Hi Jeff,
Developers are using sql developer & the below errors were reported while debuggging the procedure.
ORA-30683 : failure establishing connection to debugger
ORA-12535 : TNS : operation timed out
ORA-06512 : at “SYS.DBMS_DEBUG_JDWD”,
Developers can connect normally to the database but the problem is occuring when they start debugging.
Please update needs to be done to solve the issue.
Regards,
Shadab
Can the database connect to your machine? Make sure there’s no firewall getting in the way.
Yes DB is able to connect to my machine.
Regards,
Shadab
On the debugger port, 4000? If so, then I would advise opening a Service Request (SR) with My Oracle Support (MOS.)
Thanking you for the prompt response
Can the database connect to your machine? i:e you mean to say that whether i am able to ping to my desktop isn’t it ?
First the errors were different now the errrors are different.I am getting below errors now.
Could you please assist ?.
Executing PL/SQL: ALTER SESSION SET PLSQL_DEBUG=TRUE
Executing PL/SQL: CALL DBMS_DEBUG_JDWP.CONNECT_TCP( ‘192.168.250.36’, ‘55640’ )
ORA-30683: failure establishing connection to debugger
ORA-12541: TNS:no listener
ORA-06512: at “SYS.DBMS_DEBUG_JDWP”, line 68
ORA-06512: at line 1
Process exited.
Thanks
The database server is trying to connect to your machine at that IP on port #55640 – so make sure Windowws Firewall or network security isn’t preventing that.
Ping, basically. You could try to do a telnet FROM the database server to your SQLDev client machine on port 55640 to test.
I could successfully follow the steps till setting a breakpoint.
But I find that some debugging menu options are greyed out(disabled).
All the menu options in the Run Menu are disabled/greyed out.
It’s bugging me a lot. I have been searching this almost for a month now over the internet. Please guide me.
It’s my standalone machine : Oracle 11g, sqldevelopr 3.2, XP, VirtualBox, Host-Mac OS X Mav.
Thanks
MSimms – I see what you are talking about there – getting hung up at connection. I have your exact problem. Did adding the Domain Connections exception for sqldeveloper.exe work? I am anxious to get the “super powers” of a dynamic debugger. 🙂
Under Domain Networks, it is set to block all connections to programs not on the exception list.
I’ll check to make sure the SQLDEVELOPER.EXE is on the list.
I cannot get the debugger to initiate:
Executing PL/SQL: ALTER SESSION SET PLSQL_DEBUG=TRUE
Executing PL/SQL: CALL DBMS_DEBUG_JDWP.CONNECT_TCP( ‘10.117.46.69’, ‘62142’ )
ORA-30683: failure establishing connection to debugger
ORA-12535: TNS:operation timed out
ORA-06512: at “SYS.DBMS_DEBUG_JDWP”, line 68
ORA-06512: at line 1
Process exited.
Disconnecting from the database EM-Test.
I did get the DBA to provide authorization, but the connection appears to be hosed. Using 4.0.2 release.
Note: I can establish a breakpoint, but the watches are disabled.
Hey Mark,
The database makes a connection to your client to start a debug session – is there a firewall preventing the database server from reaching your desktop?
I am looking for a way to interrupt our nightly build process in case of compilation errors. Currently we are using dbms_utility.compile_schema.
I did not found such option there. Do SQL developer provide an option to to compile schema from commadn line and abort schema compilation in case of any compilation error (or did you know how to do this in sqlplus)?
many thanks in advance
ole
Any hints, links or suggestions about running the debugger in v4 over a VPN? I appreciate such a scenario is rather complex with firewalls and routers in the way – interested to hear if anyone is doing this successfully.
It all comes down to can your database server initiate a connection back to where SQL Developer is running. So first things first, can the server ping your machine, and is there a outbound firewall for TCP on the default debugger ports which start at 4000 or so.
Thanks Jeff, it was an errant network ACL which was preventing the server connecting back to the local VPN client – now all under control and working fine.
Could you please explain in detail what changes you made to get the DEBUGGER working over VPN. I suspect I might also be facing the same issue
Thanks
Hi.
How i can do “select” from debug session?
I want see how my data (in Tables) changed during debug
JDWP doesn’t currently support running queries over the debug session. It’s something we’re looking into though, so stay tuned 🙂
For now you’d have to actually query that into a pl/sql table and use a watch…a lot of work, but that’s how it is.
Thank You.