
Updated: April 13, 2015
Reports are great ways to access data on demand without having to write and run the code over and over.
Sometimes you want to take the results of a query and feed it to another query as an input or parameter.
Wouldn’t it be great if you could fire off a report based on the selected value of another report?
This is the basic premise of a Master/Child report.
For this example, I’m going to use my ITUNES table – you can follow along if you want. Just read that post and build your own demo table(s) from YOUR iTunes library.
I want to be able to select one of my albums and then see all of the songs/tracks for THAT specific album.
The Base Report
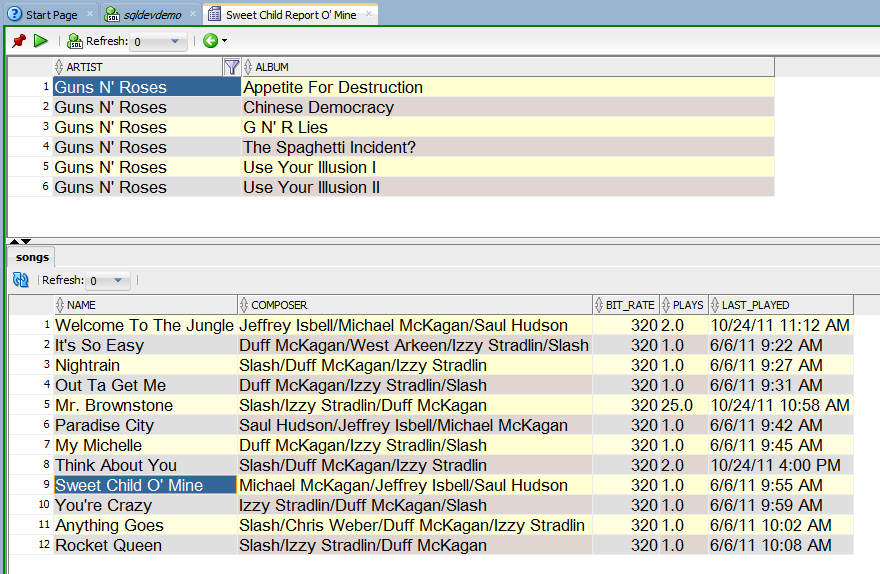
For the parent report I am going to use my previous beer example. It’s a table report, and here’s the underlying SQL statement:
SELECT DISTINCT demo.music_artists.artist, album
FROM demo.music_artists, demo.itunes_music
WHERE demo.music_artists.artist_id = demo.itunes_music.artist
ORDER BY artist ASC, album ASC
Note that when you bring in your ITUNES library, everything comes over as a single table. In a previous post I showed how can you automatically normalize your data using SQL Developer. So NOW, I have two tables, MUSIC_ARTISTS and ITUNES_MUSIC. I didn’t normalize it very far, I could have continued with ALBUMS, but you get the idea, I hope.
Running this report gives me a report that looks like this:
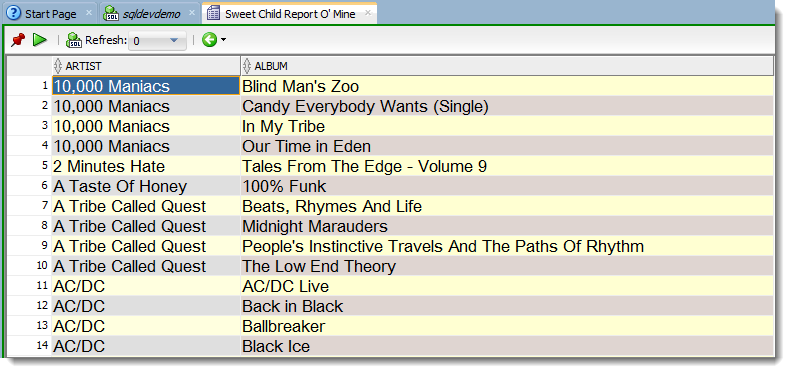
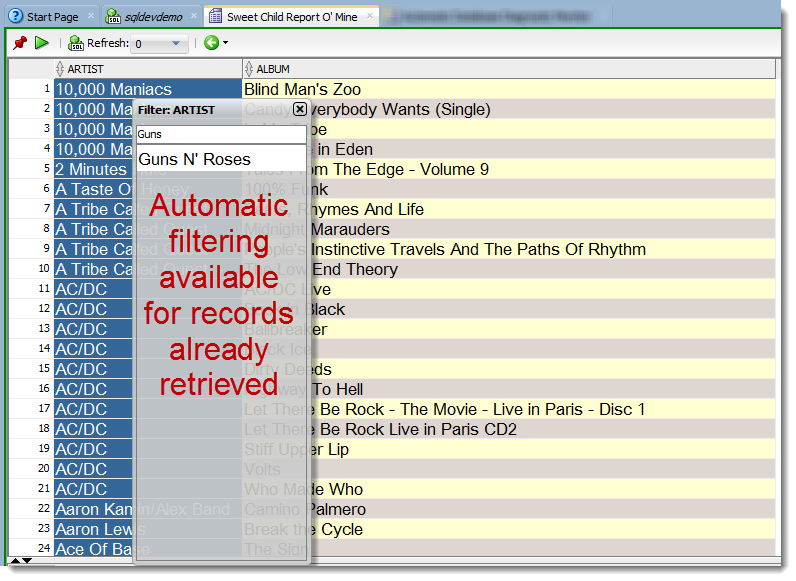
Why yes, yes you CAN filter.
Mousing over the column header will give you a funnel icon – clicking on that will give you a dialog to find just the records you want to view.
Note that the distinct value list is determined client-side. We do NOT re-query the database as that can be expensive. So you’ll only see the distinct values that have been fetched so far to the report.
Now, how do I get the song titles?
Now let’s add the child report
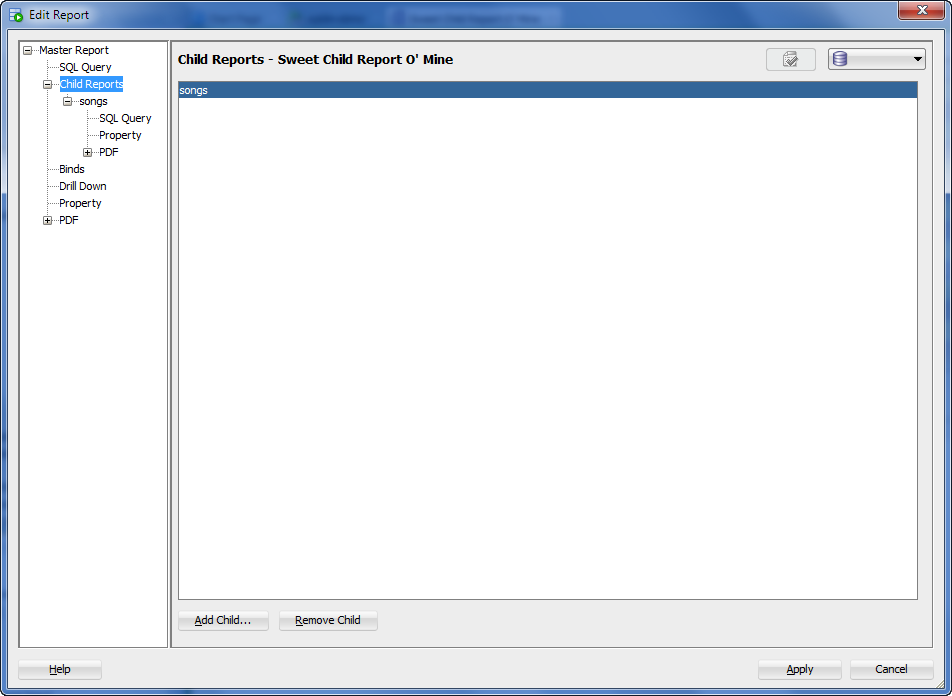
Right-click on the report in the tree and choose ‘Edit Report.’ We are going to go to the Child Reports tree and ‘Add Child.’
Where do we go?
Where do we go now?
Where do we go?
I am going to choose a style of ‘Table’ for the report. I just want a grid style list of album tracks by the selected artist. The most important information to provide here will be the query that will be used to populate said grid. To tie the two datasets together, we need to use a bind variable. The ‘trick’ here is to uppercase the bind variable name to match the column name from the master query.
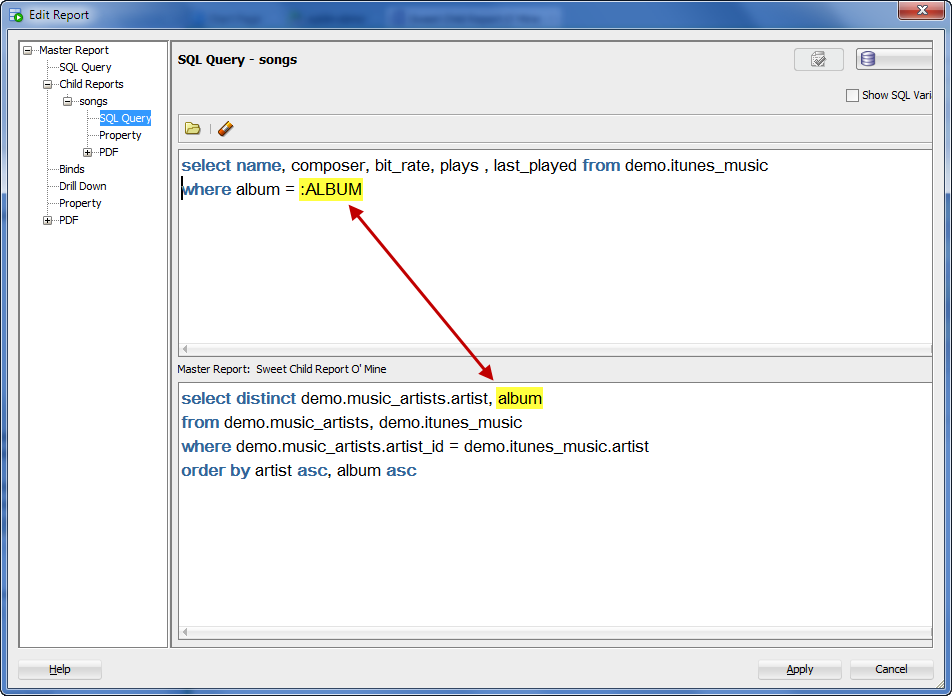
For this particular report, the bind feeds off the album name. So my child report query looks like this:
SELECT name, composer, bit_rate, plays , last_played FROM demo.itunes_music
WHERE album = :ALBUM
As I click on a album in the master chart report, that value is fed to this query and will populate the grid for the child report.
Where do we go?
Where do we go now?
Where do we go?
The Completed Master-Child Report
Where do we go now?
No, no, no, no, no, no
Sweet child,
Sweet child report of mine.
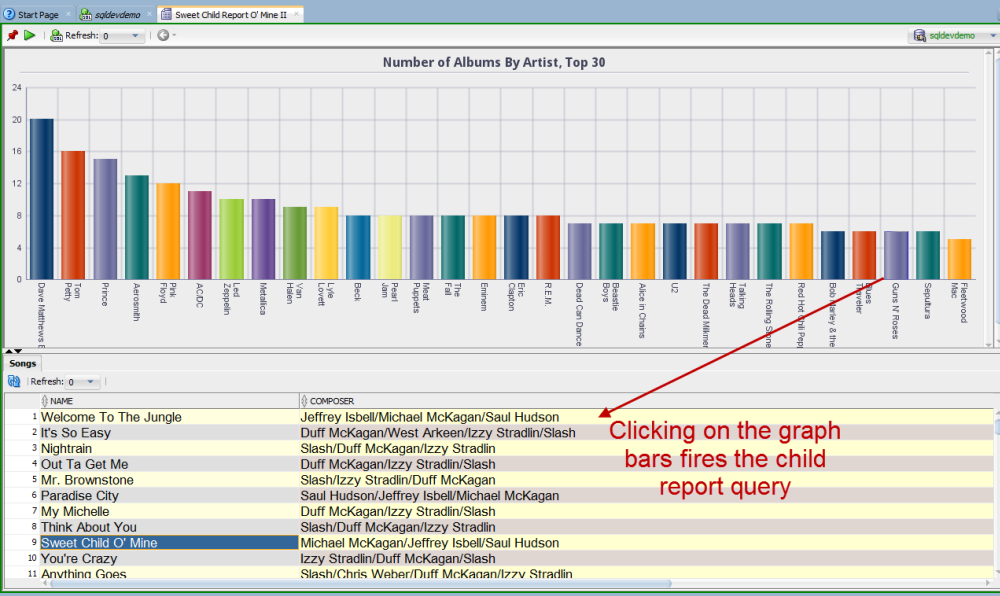
Grids are boring, does this work with charts, too?
Yes! Although we previously had a bug in SQL Developer where it would break the child reports when your Master report was of type CHART – so make sure you’re on at least version 4.0.3. The concept is exactly the same. Query to supply data up top, reference value from first dataset in a report down below, ties in on :UPPER_COLUMN_NAME.
Version 4.0 Makes This So Much Simpler and More Powerful Too
Simpler, and more powerful? Yes. Simpler – you can live-preview the report as you’re designing it. More powerful – you get way more control over exactly how your charts look. Plus, you have 50+ new charting options to choose from.
I’m not a tease, so for your listening enjoyment…


9 Comments
I’m now on SQL Developer 4.2, and have been using SQL Developer’s report and child report functions extensively for some time now. I find them incredibly useful so thanks for this great feature.
One thing I’d really like though but haven’t found, would be to be able to select the child reports from the library of available reports rather than having to duplicate the code for them each time. Often I am analyzing data using a variety of “parent” reports, but when I want to inspect the underlying data returned on the main report, I often have the same requirements (e.g. what are the details for the “widget” that is linked to this “thing”?).
So I end up with copying and pasting child reports that say
select x,y from widget where widget_id=:WIDGET_ID
And if I ever decide that it would be really useful to also return z from the widget table, I have to modify the child reports everywhere. Is there an option somewhere I have overlooked, or is this something that maybe you could add in the future ?(e.g. “simply” specify the name of an existing report as the child report, and have SQL Developer pick it up dynamically when the parent report is executed).
Hello
Is it possible to hide the column name on the master query that is used to match to a bind variable ?
You can hide the columns once the report has ran, but that’s the best I can come up with for now.
I think the short answer to your question is, ‘No.’
Just did my first Stacked report for some production monitoring. How do i avoid 2 decimal places in the column which is a count(*) ?
Hi Jeff,
thank you for your blog.
Do you know how to avoid decimal digits in the result if any group operation like count(*) is performed ??
Thanks
Maybe you could implement it like an automated report with the foreign key fields automatically used by the child sub reports.
You might want to vote on this feature:
https://apex.oracle.com/pls/apex/f?p=43135:7:0::NO:RP,7:P7_ID:7701
(It’s already in state ‘accepted’ but maybe it helps prioritise?)
I’d like to have something like that, but simpler:
I want to select a value in the normal data view of a table and if the selected field is a foreign key constraint of another table, the Sql Developer should show me another dataview popup where the row of the foreign table is filtered.
just to see what kind of stuff is behind an ID, for example.
In other products these foreign key fields inside the dataview have some “…” behind it (a button). When the button is pressed the foreign table will be show filtered as described above.
Is it possible to implement? I find it very useful in daily work.
Sweet!