Stepping through your PL/SQL code is fun – but often you want to be able to ‘jump to’ a specific iteration of a loop or maybe when a certain condition evaluates to true.
Wait – how do I get started using the debugger??? Read this!.
By default a breakpoint will always ‘break’ the execution. This is assuming your breakpoint is on an EXECUTABLE line. If you place a breakpoint in a comment, there’s nothing for the database to execute, so nothing to ‘break’ execution.
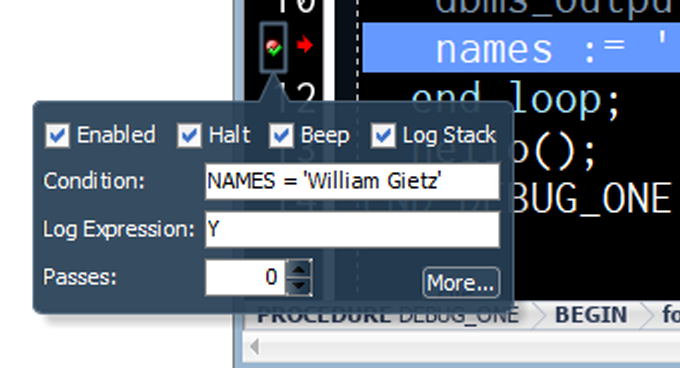
‘Condition’ and/or ‘Passes’ optionally allow you to define when the breakpoint will be honored.
If you hover over the breakpoint, you can add your conditions and passcounts there. Or you can use the breakpoints panel. I prefer the mouse hover, it’s faster and no navigation required!
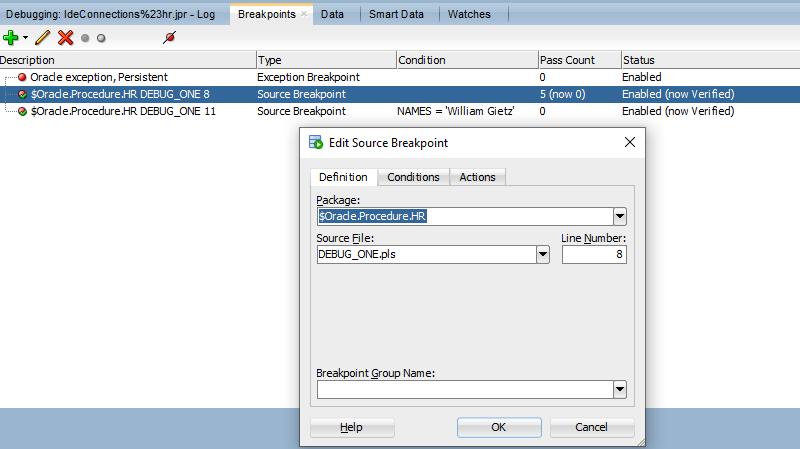
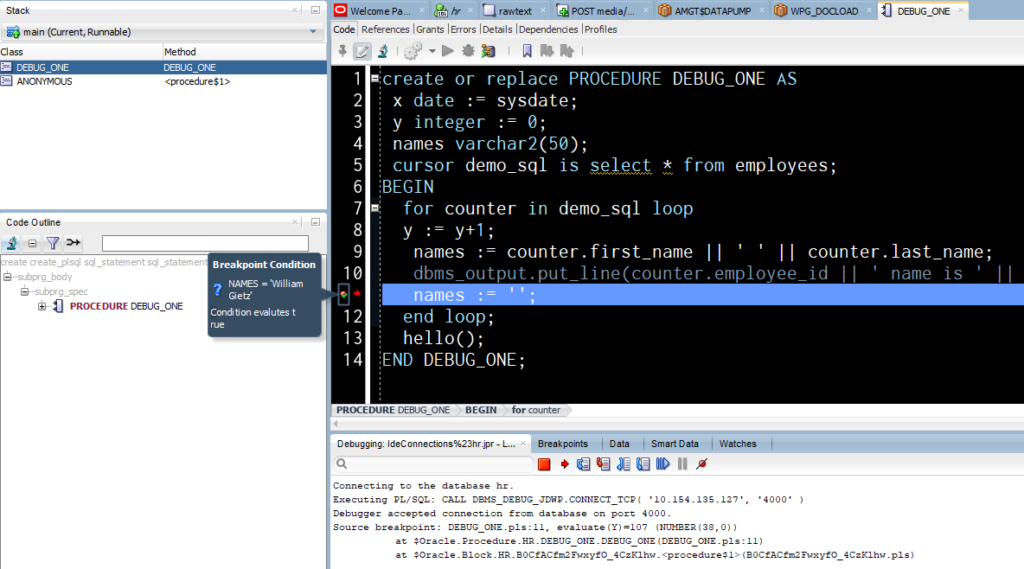
So on my line 11 (executable line 8), if the local ‘names’ pl/sql variable evaluates to that string at that point in the Call Stack, the execution will pause.
An important note: the variable name must be in UPPERCASE. The database tracks these identifiers in the system in UPPERCASE. So for example, these conditions –
names = ‘Something’ won’t work but
NAMES = ‘Something’ will work.
The flags/checkboxes are pretty self-explanatory, but ‘Beep’ will play your OS notification sound, and ‘Log Stack’ will write a line to the debugger panel.
Note that Y is another local pl/sql variable –

What is sounds/looks like when it ‘breaks’
Or, if I have a passcount assigned to my line, say I don’t want to stop until this line has been executed 5 times…
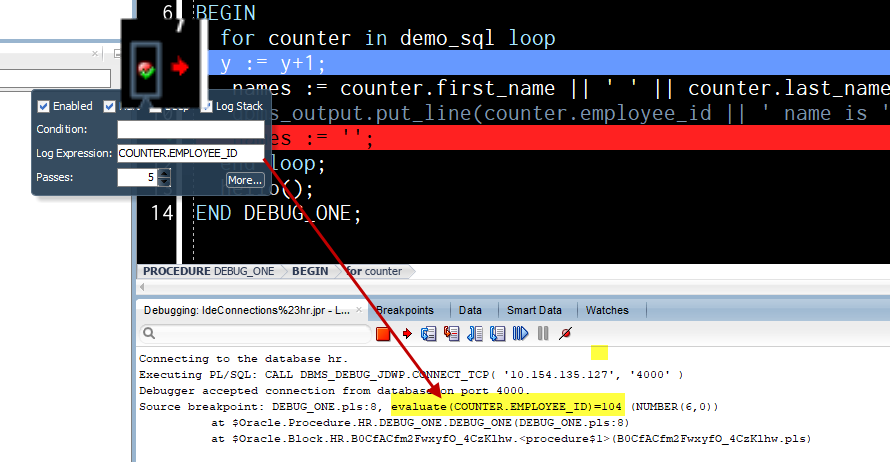
You’ll see that I’ve asked the EMPLOYEE.ID to be logged, and I’ve put that in UPPERCASE into the breakpoint expression area.
A few more rules:
- Complex types are not supported
- Numbers, varchars, and booleans should work
- Functions are not supported
I’ll have some more exciting debugger news once version 20.2 of SQL Developer is released (June’ish) – so stay tuned!


