
I have a PL/SQL block of code – I wonder where most of the time is being spent to execute it? Well guess what? The PL/SQL team has given us an interface to answer this exact question.
The PL/SQL Hierarchical Profiler does 3 things of note:
- Reports the dynamic execution profile of your PL/SQL program, organized by subprogram calls
- Accounts for SQL and PL/SQL execution times separately
- Makes me feel like an idiot whenever I try to pronounce ‘hierarchical’
Did you know: SQL Developer makes using the profiler very easy!
For the profiler to be available, you’ll need :
- a Database Directory to write generated some reports
- a few local (to your schema!) tables
SQL Developer will take care of these pre-requisites for you if you ask for a Profiler run and they’re missing from your system. You’ll just need a high-level priv account to go out and create the DB Directory – be ready to ask a DBA for help in other words.
Ok, so pre-requisites accounted for, and I’m ready to start my profiler run.
When it’s done, I’ll see where the “suck” is, i.e. where I need to go to have the biggest impact on performance when it comes to tuning my SQL or PL/SQL.
Hit this button in the Code Editor – Next to Debug.

Give your profiler run a name.
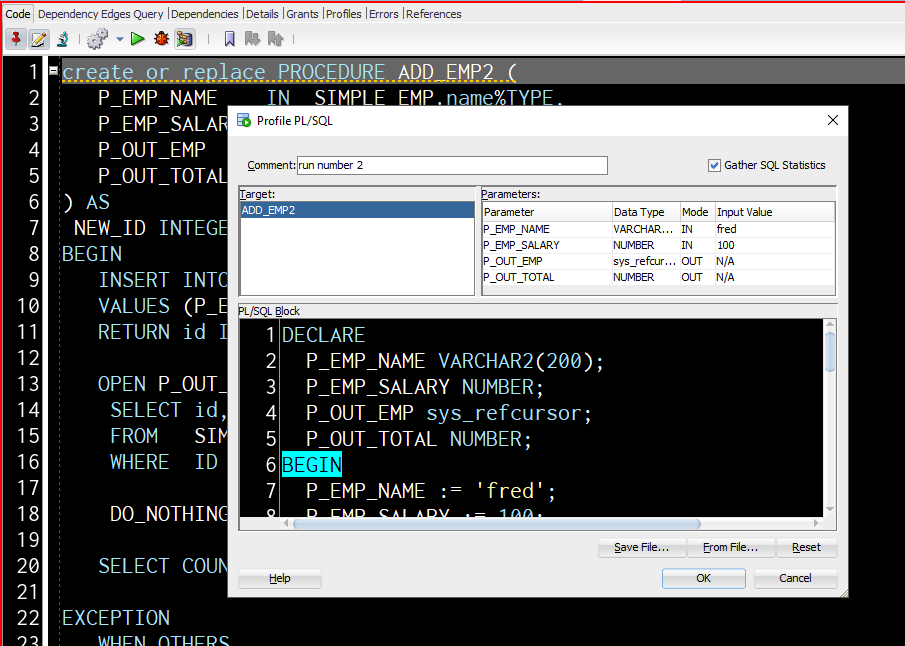
So it should be obvious by now, but if it’s not – we’re about to EXECUTE this block of code, and the profiler is going to record everything going on in terms of execution time.
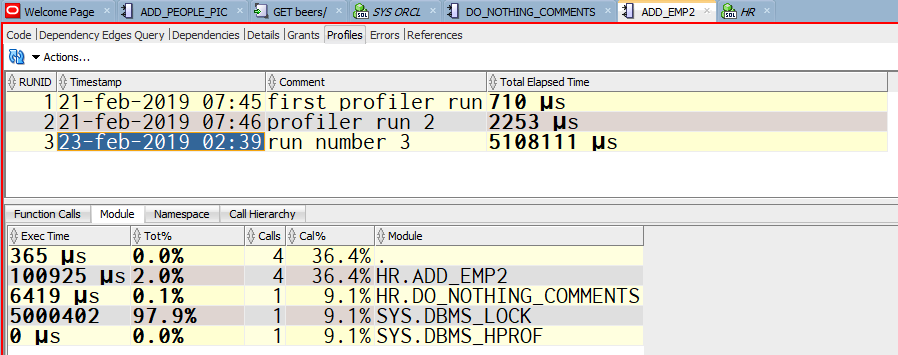
Once the profiler run has finished, we can head over to the Profiles panel in the code editor.
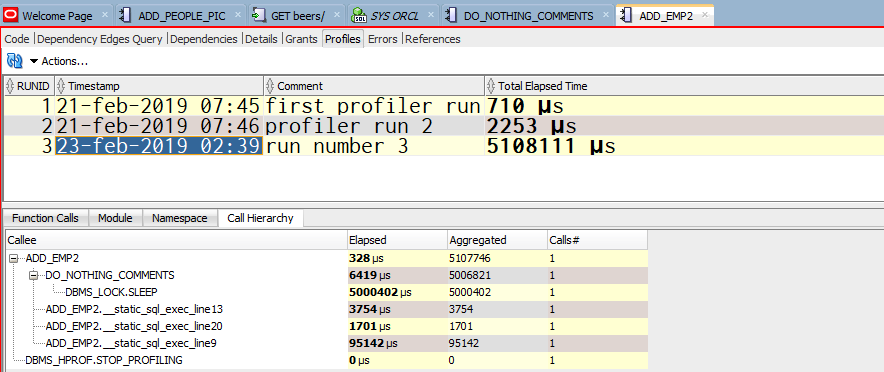
We can see that ADD_EMP2() also called something called DO_NOTHING_COMMENTS(), and THAT called something DBMS_LOCK(), which took….5,000,402 μs.
Wait, what’s that? It’s a fancy way of saying that one call took 5 seconds, whereas the entire run took only 5.1 seconds, so something weird was happening there.
We can also see that there were some ‘static sql executions’ as well. Tell me more!
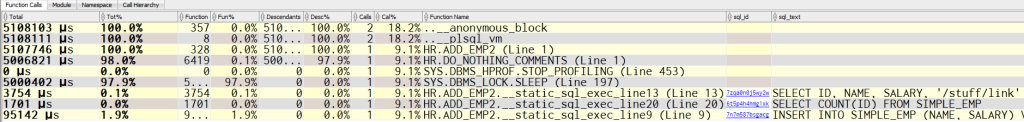
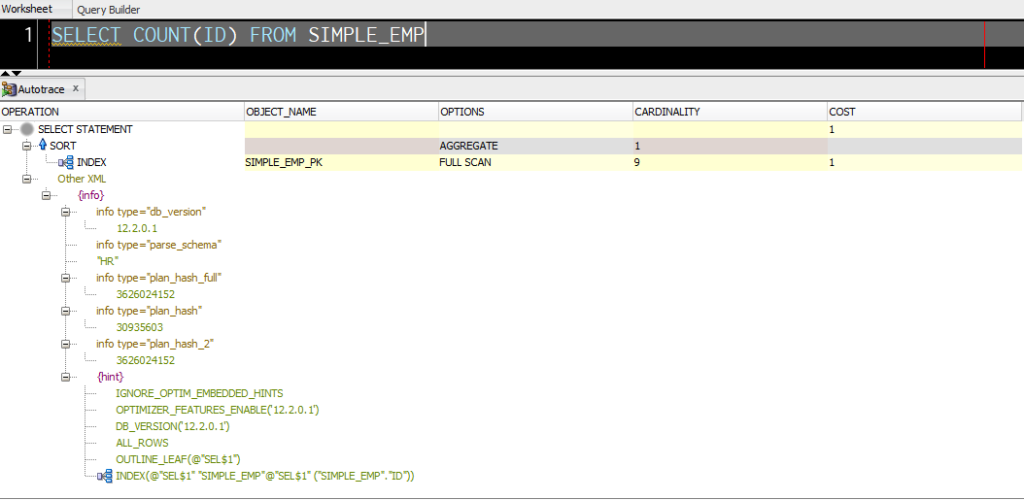
If I click on one of those SQL_ID’s, then we can look at it’s associated plan in v$sql_plan –
Of course, you could also open up our RTSM Report and see if the Run was still in there…but, that requires the Tuning Pack license for your database.
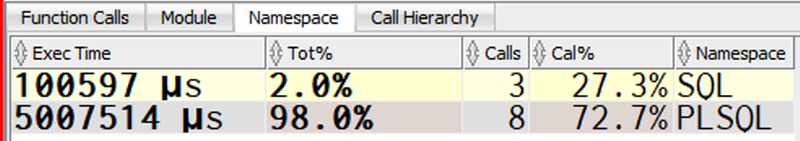
Remember how we started this post with the promise to track SQL and PL/SQL run times separately? That’s what we’ll see on the Namespace tab –
And finally we have the module overview – which is a flattened view of the Call Hierarchy:
This is a somewhat NEW feature.
It was introduced in 11gR1 – you can read about it new New Features Guide.
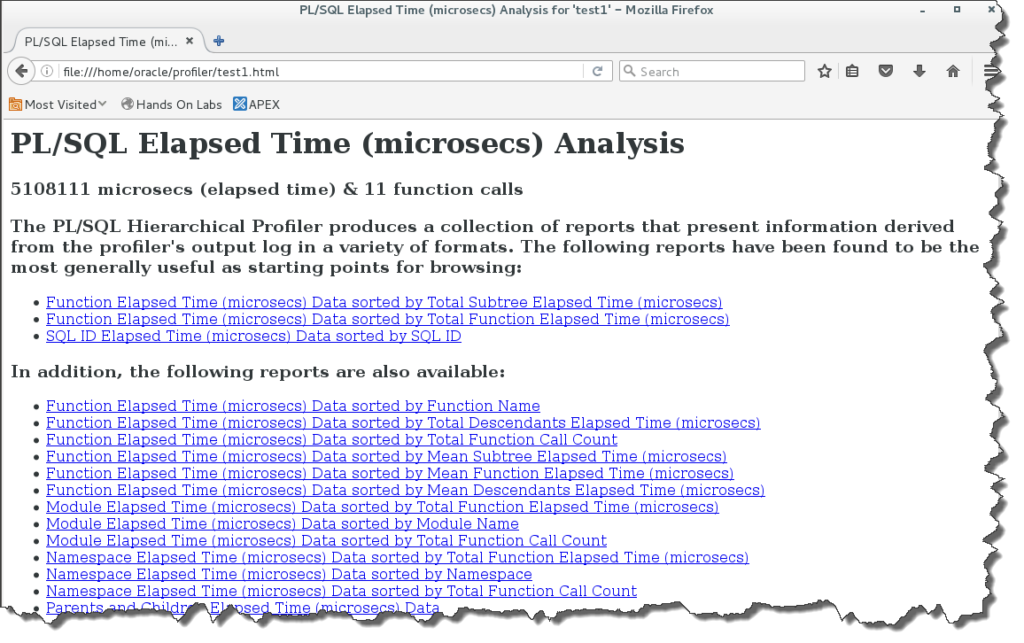
Remember how I said up above you needed a Database Directory? Guess what’s in there? That’s right, some HTML reports.
One last thing, a bug.
I found after running a profile capture, I had to close the editor and re-open to see the actual reports. I hope to have this fixed in time for version 19.1.


7 Comments
Thanks for the tip!
I agree with others that this feature would be much more user friendly if output could be directed to a table, similar to the explain plan feature.
Also, I ran into an issue when I first tried it. I got an error about missing tables. After googling the problem I found that I had to run the following:
EXEC DBMS_HPROF.create_tables;
and then it worked okay.
I’m not sure why the database directory is available when all the data you need is in the tables…and sqldev should offer to create those tables for you, but I’m glad you got it going.
When I tried running DBMS_HPROF.create_tables, I got prompted for a sys password. The client I’m working with guards that zealously even for dev environments, I’m not sure if it’s trying to create tables, the directory object, or what, but I’d like to have a table description so I can create them in my user schema. The 19c documentation isn’t much help.
“The client I’m working with guards that zealously even for dev environments” — good!
Ask your client to setup the development environments they’d like fast PL/SQL for the Profiler. They can do the setup work, and you can just ‘click the buttons.’
It’s a great feature but it’s just a pity that it requires a database directory to be created. People who work in corporations are well aware that such requirement is at least very difficult to obtain if not impossible. Why not writing that information into a table like the explain plan does?
I’ll share your feedback with the PLSQL team.
I fully agree with you, especially your last sentence.