
People seemed to like the Instance Viewer we built for version 4.1.
So we wanted to use similar technology (Java FX) to build a new interface for the Oracle Database Tuning Pack’s Real Time SQL Monitor.
So we did.
If you don’t have EM Express or Enterprise Manager available or handy, you can get the report in all it’s live, refreshing glory, in SQL Developer’s DBA Panel. It’s also on the Tools menu.
A Quick Demo
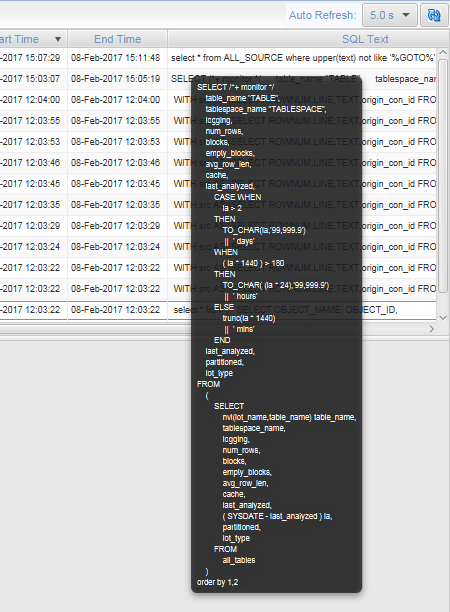
We sort the queries by run time, so the most recent, and currently running ones should be up top.
We also make the SQL in question easily accessible – and readable – by giving you the formatted SQL text on a mouse-hover bubble window.


13 Comments
I’d love to use this Feature more often, as wouldn’t Need to Switch over to Enterprise Manager.
In Enterprise Manager I’m able to see the real time plan statistics, but in SQL-Developer the window is greyed out.
I’m using the same user-identification and don’t know what privilege could be missing. Do you have any idea about that?
Check view > Log > Statements panel. You’ll see the queries we’re running to get that info.
Thank you for the fast reply. I found the corresponding SQL and after some adjustment to the Parameter sqlexecstart which was timestamp and not date, the SQL itself ran. So it doesn’t seem to be a privilege-Problem. I’m also unsure if the Parameter and value for sqlexecstart are the Problem, as the metrics-tab works/displays fine and uses the same Parameter.
Hi Chris,
Did you resolve this? As I have exactly the same problem.
Thanks
Very nice article posted by you on sql monitoring .keep updatin such articles.
Thank you.
Jeff- This is a great start. Can you add the Activity% and reporting of individual wait events, just like the real SQL Monitor does? For instance, if you hover over the Activity% in the real SQL Monitor it will show you individual wait events like “cell table smart scan” as you move along the activity% color bar. This individual wait event is available for the overall query and the individual plan lines.
SQL Developer 4.2 does not have an Activity% for the query as a whole (it has a database time, but that does not show individual wait events). And SQLDev 4.2 does have an Activity% for the plan lines but unlike the real SQL Developer, it does not break out individual wait events.
Client satisfaction and shifting your goods in one single piece without any damage is the main aim and motto of our Company.
Hi Jeff, the real-time monitoring is a great in SQL Developer.
One feature from 4.1 which seems to be gone though is the ability to save/export the SQL monitoring results into a web page. This was great for sharing, collaborating, keeping record of issues encountered. Can this be re-instated?
it generated html that would run FLASH off of resources from OTN, and wasn’t compatible with 12c style reports…we need to build a new one. It’s definitely ON the list
Is there a timeline when we can expect this feature “ability to save/export the SQL monitoring results into a web page” in SQL Developer 4.2?
Hi Jeff,
I don’t see this feature in Version 18.1, are you planning for that ?
Regards
Ravi
Hi Jeff,
Would be really great to have this ability to save the SQL monitoring results into a web page or even to a Word document.
You can also include a report of the database activity history for the last few days/weeks/months.
These are good for reporting purposes.
Bob
It ALMOST made it for 18.2.
So, will just need to wait a few more months.