
The ubiquitous HR.EMPLOYEES table – how many different ways can we look at this data?
How much money people make, by department?
By reading the column comments, we know that HR.EMPLOYEES.SALARY is
“Monthly salary of the employee. Must be greater than zero (enforced by constraint emp_salary_min)”
So let’s chart that.
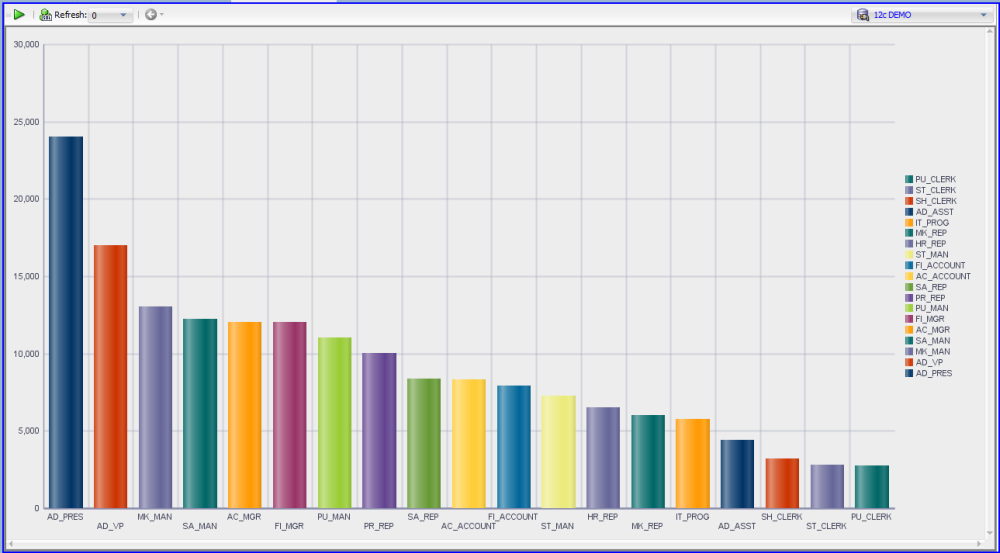
This charts the data we get back from
SELECT avg(SALARY), JOB_ID FROM HR.EMPLOYEES
GROUP BY JOB_ID
ORDER BY 1 DESC
We want our reports, charts, and pictures to tell a story. Maybe this data would make more sense if we had some point of reference? Like, how much money did I make in my first job out of college?
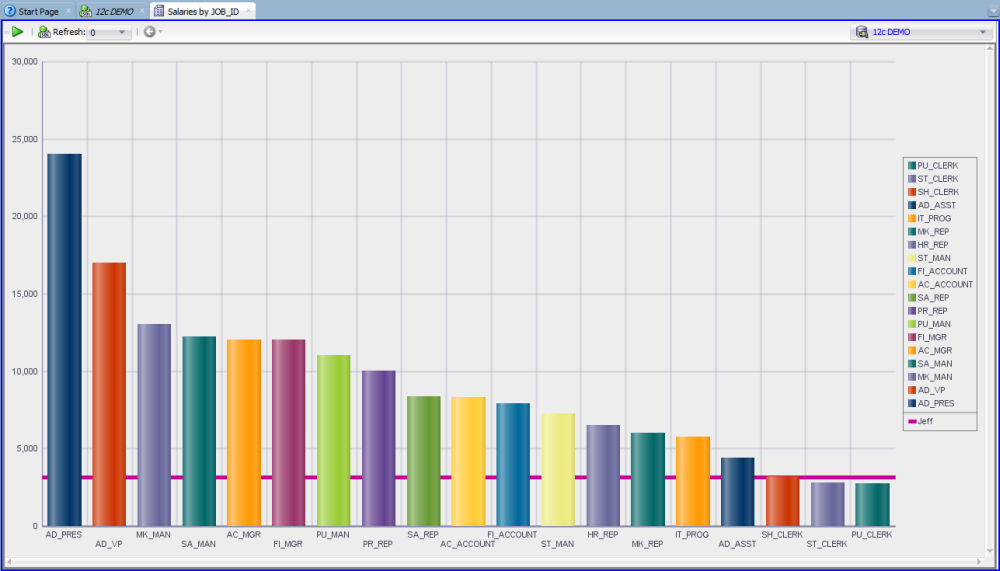
Adding the Static Chart Element
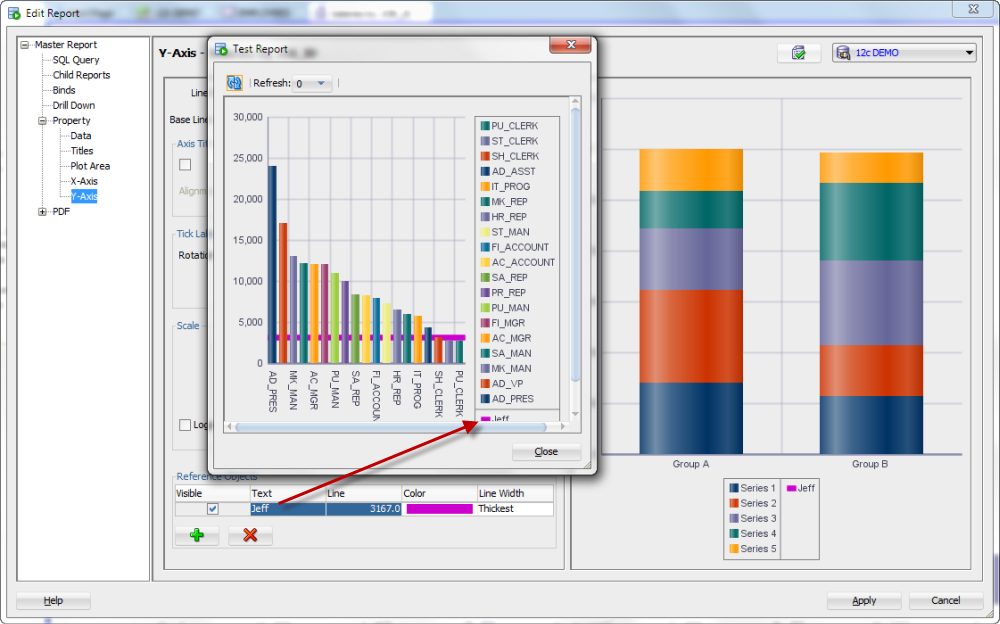
Remember, you can select a connection during design-time to live-preview your chart as you design it. Hitting the check-box ‘test’ button in the upper right hand corner generates the chart with the live-data from the query defined in the report.
This ability to test your reports as you go is one my big reasons you should upgrade to version 4.0 of SQL Developer. The others being, of course, that any other version is quite old now, and that Java 7 runs much better than Java 6. But that’s a different sermon, and we’ll save that for another day.


4 Comments
Hello ,
Thanks for the content of this blog ! Is there a way to add more number of series along with colors in charts to avoid color repetition ?
Thanks ,
Sonia
Yes, but it involves editing the XML used to define the report. I’ve seen someone post an example, somewhere, here maybe even, or in our Forums – but I can’t find it at the moment.
Beginner (n00b) here: The report can be exported (to say) HTML with data on it and so, share the HTML?
I would like to generate the report as you shown, but If I understand correctly (either in this post or in another post of yours), you have to give your client the connection settings (I mean, the client must be able to connect to the database).
This is not a hoemwork or related, just curious about how would report sharing works “outside of making a development that executes the report”.
Yes, the report can be exported to HTML..with data.
Yes, you can share the report, but yes the person you’re sharing with would have to have access to the database.