

With some excellent feedback from our friends on the In-Memory and Real World Performance tuning groups here, we made the following improvements to the SQL Monitoring interface in SQL Developer:
- Availability of Other stats now indicated with a button on the report grid
- In-memory stats available, shown in a different color and an expanded toolbar message
- Columnar encodings stats from xml now included
And, because we knew we needed to, we got the Performance Charts added to the HTML report exports.
When we know there’s more information available, we indicate that with a little camera button –
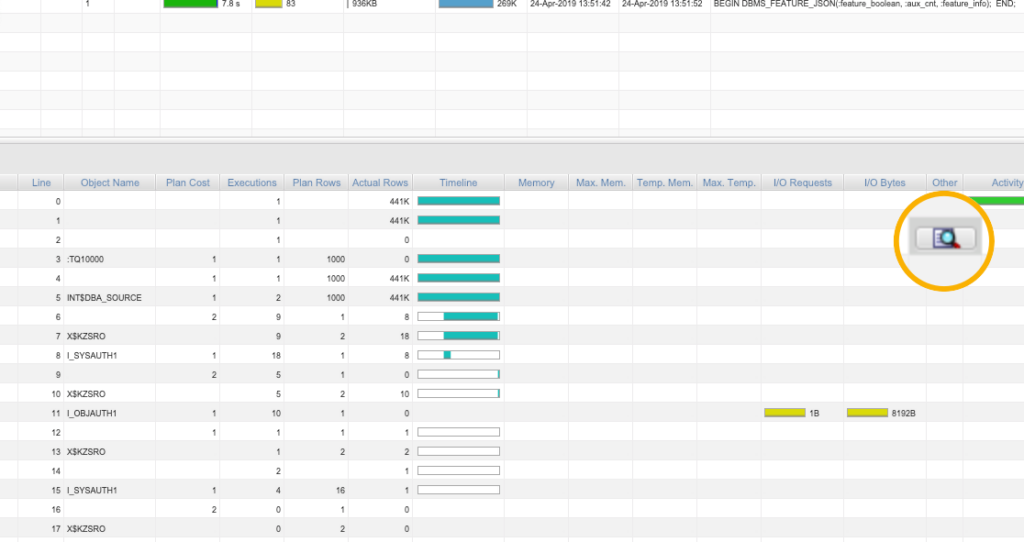
Click on said button, and I can see my Degree of Parallelism was DOWNGRADED TO 1!!!
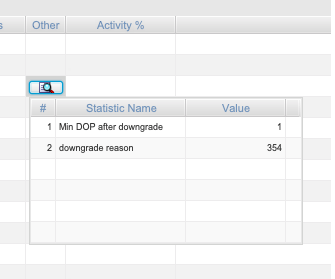
Actually, it’s because of reason 354. You know these by heart, yes?
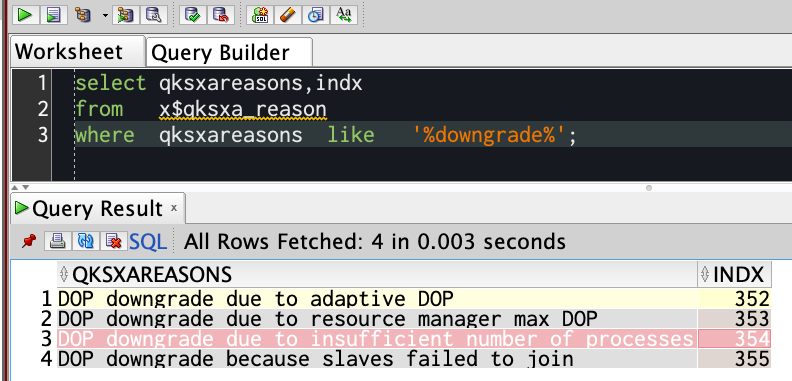
The query (as that’s not a fun one to type, and yeah x$ – you’ll need high privs to see this, but you already need high privs to run these reports, so hopefully it’s OK):
SELECT	qksxareasons,indx
FROM	x$qksxa_reason
WHERE	qksxareasons LIKE '%downgrade%';
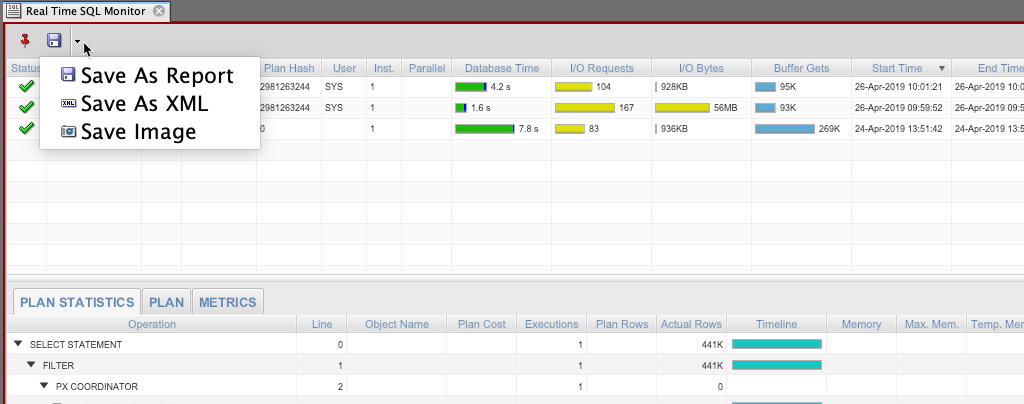
Nicer, more complete HTML exports.
Now when you use the Save button, you have the option for HTML (no flash!), a screenshot, or the raw XML you need to do a transform. 99% of you will be fine with the HTML.
And finally, the HTML now includes these (the Metrics Graphs) –
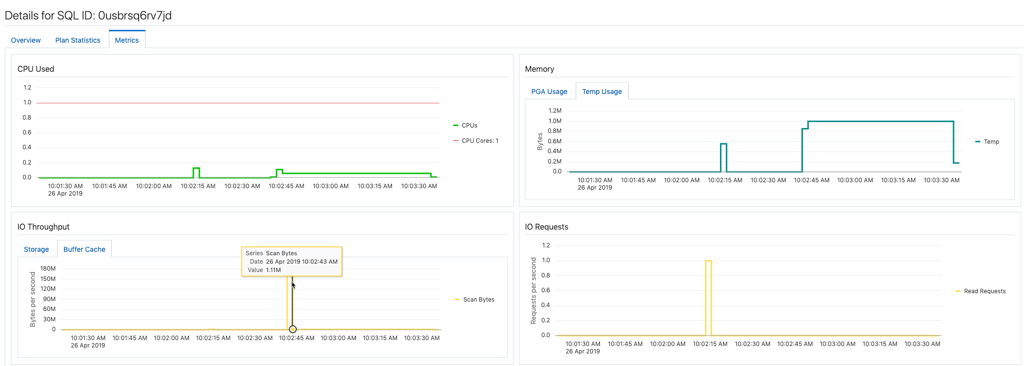
Remember folks – this feature requires the Tuning Pack.
I show you the features, but you need to know when/where you can use them. If in doubt, check with your Oracle account manager BEFORE you start running these reports.


4 Comments
Do you think you’ll add a filter option the Realtime SQL monitor in the future?
Standard filtering on user, status, duration, starttime and endtime would be nice and hopefully it might help performance.
Where this good idea?
Do you think you’ll add a filter option the Realtime SQL monitor in the future?
Standard filtering on user, status, duration, starttime and endtime would be nice and hopefully it might help performance.
Best regards
It’s a very cool feature but you may want to put the note about Tuning Pack requirement at the beginning. Many people will pull this up and follow step by step to see how it works and then they’d be responsible for the costs of using the Tuning Pack when Oracle comes in for an audit. Just my 2 cents.
Still a cool feature – especially the reports.
The tool warns you when you open it for the first time. And I do bring this up, or try to, every time i show, demo, blog, video it. But yeah.
Same thing could be said for partitions, compression, so many things.