
We introduced the Instance Viewer in v4.1.
We show you in real time what’s happening in your database.
To get there, open your DBA panel. Connect. Then go to the Database Status node.
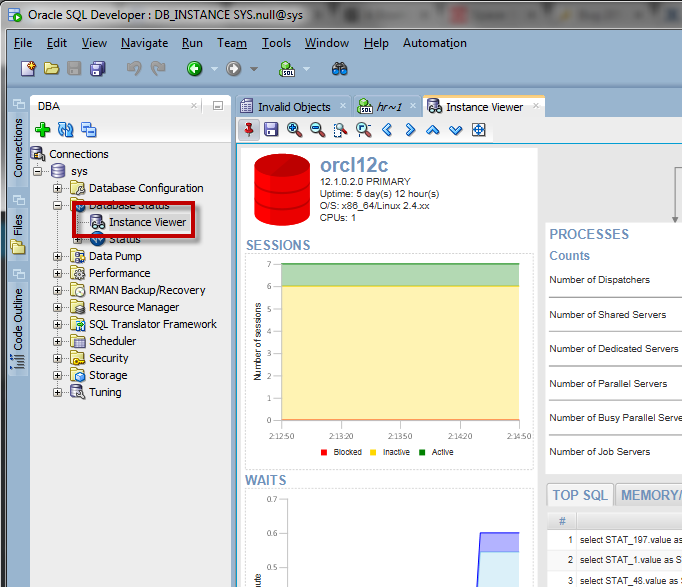
Storage bits are interesting, but maybe you’re more excited about the specific workload. So in version 4.2, we’ve added a Top SQL panel to the screen.
It auto-refreshes every few seconds, and you can sort it by several different performance metrics.
If you find a SQL you want to know more about, you can drill down into a report.
You can see the query, plan, and bind variables quite easily.
And if you’re so inclined and licensed, you can ask for a SQL Tuning Advisor report and drill into the run time history of the query to see what’s what (requires Tuning and Diagnostic packs respectively.)
You don’t need a blow-by-blow screenshot of this feature – it’s very easy to use. But I will throw in an animated GIF.
If the animation is slow to load, click on the picture.
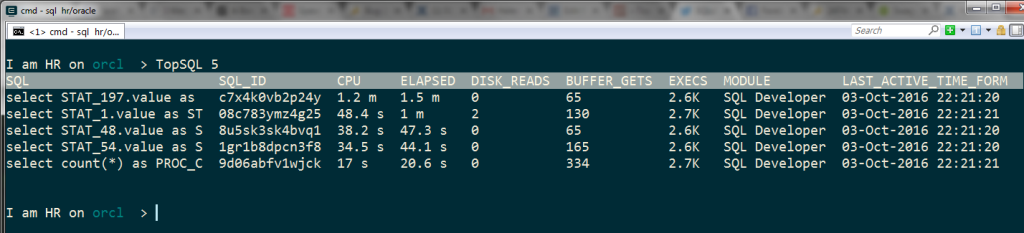
Add a Top SQL Report to SQLcl
It’s easy. View > Log > Statements. Grab our SQL. Throw it into ALIAS. Use the repeat command. Voila.
Oracle SQL Developer Tips and Tricks [CON6515] at 1:30 today will ALSO features new tips & tricks for SQLcl! pic.twitter.com/lSs5rKloJx
— SQLcl (@oraclesqlcl) September 21, 2016
Throw this into an ALIAS…
SELECT
    SQL, SQL_ID, CPU_SECONDS_FORM CPU, ELAPSED_SECONDS_FORM ELAPSED, DISK_READS, BUFFER_GETS, EXECUTIONS_FORM EXECS, MODULE, LAST_ACTIVE_TIME_FORM
FROM
    (
        SELECT
            D.*
            ,ROWNUM ROW#
        FROM
            (
                SELECT
                    D.*
                FROM
                    (
                        SELECT
                            substr(SQL_TEXT, 1, 25) AS SQL
                            ,S.CPU_TIME / 1000000 AS CPU_SECONDS
                                ,CASE WHEN
                                    S.CPU_TIME < 1000
                                THEN
                                    '< 1 ms'
                                WHEN
                                    S.CPU_TIME < 1000000
                                THEN
                                    TO_CHAR(ROUND(S.CPU_TIME / 1000,1) )
                                     ||  ' ms'
                                WHEN
                                    S.CPU_TIME < 60000000
                                THEN
                                    TO_CHAR(ROUND(S.CPU_TIME / 1000000,1) )
                                     ||  ' s'
                                ELSE
                                    TO_CHAR(ROUND(S.CPU_TIME / 60000000,1) )
                                     ||  ' m'
                                END
                            AS CPU_SECONDS_FORM
                            ,DECODE(L.MAX_CPU_TIME,0,0,S.CPU_TIME / L.MAX_CPU_TIME) AS CPU_SECONDS_PROP
                            ,S.ELAPSED_TIME / 1000000 AS ELAPSED_SECONDS
                                ,CASE WHEN
                                    S.ELAPSED_TIME < 1000
                                THEN
                                    '< 1 ms'
                                WHEN
                                    S.ELAPSED_TIME < 1000000
                                THEN
                                    TO_CHAR(ROUND(S.ELAPSED_TIME / 1000,1) )
                                     ||  ' ms'
                                WHEN
                                    S.ELAPSED_TIME < 60000000
                                THEN
                                    TO_CHAR(ROUND(S.ELAPSED_TIME / 1000000,1) )
                                     ||  ' s'
                                ELSE
                                    TO_CHAR(ROUND(S.ELAPSED_TIME / 60000000,1) )
                                     ||  ' m'
                                END
                            AS ELAPSED_SECONDS_FORM
                            ,DECODE(L.MAX_ELAPSED_TIME,0,0,S.ELAPSED_TIME / L.MAX_ELAPSED_TIME) AS ELAPSED_SECONDS_PROP
                            ,S.DISK_READS AS DISK_READS
                                ,CASE WHEN
                                    S.DISK_READS < 1000
                                THEN
                                    TO_CHAR(S.DISK_READS)
                                WHEN
                                    S.DISK_READS < 1000000
                                THEN
                                    TO_CHAR(ROUND(S.DISK_READS / 1000,1) )
                                     ||  'K'
                                WHEN
                                    S.DISK_READS < 1000000000
                                THEN
                                    TO_CHAR(ROUND(S.DISK_READS / 1000000,1) )
                                     ||  'M'
                                ELSE
                                    TO_CHAR(ROUND(S.DISK_READS / 1000000000,1) )
                                     ||  'G'
                                END
                            AS DISK_READS_FORM
                            ,DECODE(L.MAX_DISK_READS,0,0,S.DISK_READS / L.MAX_DISK_READS) AS DISK_READS_PROP
                            ,S.BUFFER_GETS AS BUFFER_GETS
                                ,CASE WHEN
                                    S.BUFFER_GETS < 1000
                                THEN
                                    TO_CHAR(S.BUFFER_GETS)
                                WHEN
                                    S.BUFFER_GETS < 1000000
                                THEN
                                    TO_CHAR(ROUND(S.BUFFER_GETS / 1000,1) )
                                     ||  'K'
                                WHEN
                                    S.BUFFER_GETS < 1000000000
                                THEN
                                    TO_CHAR(ROUND(S.BUFFER_GETS / 1000000,1) )
                                     ||  'M'
                                ELSE
                                    TO_CHAR(ROUND(S.BUFFER_GETS / 1000000000,1) )
                                     ||  'G'
                                END
                            AS BUFFER_GETS_FORM
                            ,DECODE(L.MAX_BUFFER_GETS,0,0,S.BUFFER_GETS / L.MAX_BUFFER_GETS) AS BUFFER_GETS_PROP
                            ,S.EXECUTIONS AS EXECUTIONS
                                ,CASE WHEN
                                    S.EXECUTIONS < 1000
                                THEN
                                    TO_CHAR(S.EXECUTIONS)
                                WHEN
                                    S.EXECUTIONS < 1000000
                                THEN
                                    TO_CHAR(ROUND(S.EXECUTIONS / 1000,1) )
                                     ||  'K'
                                WHEN
                                    S.EXECUTIONS < 1000000000
                                THEN
                                    TO_CHAR(ROUND(S.EXECUTIONS / 1000000,1) )
                                     ||  'M'
                                ELSE
                                    TO_CHAR(ROUND(S.EXECUTIONS / 1000000000,1) )
                                     ||  'G'
                                END
                            AS EXECUTIONS_FORM
                            ,DECODE(L.MAX_EXECUTIONS,0,0,S.EXECUTIONS / L.MAX_EXECUTIONS) AS EXECUTIONS_PROP
                            ,DECODE(S.MODULE,NULL,' ',S.MODULE) AS MODULE
                            ,S.LAST_ACTIVE_TIME AS LAST_ACTIVE_TIME
                            ,DECODE(S.LAST_ACTIVE_TIME,NULL,' ',TO_CHAR(S.LAST_ACTIVE_TIME,'DD-Mon-YYYY HH24:MI:SS') ) AS LAST_ACTIVE_TIME_FORM
                            ,S.SQL_ID AS SQL_ID
                            ,S.CHILD_NUMBER AS CHILD_NUMBER
                            ,S.INST_ID AS INST_ID
                        FROM
                            GV$SQL S
                            ,(
                                SELECT
                                    MAX(CPU_TIME) AS MAX_CPU_TIME
                                    ,MAX(ELAPSED_TIME) AS MAX_ELAPSED_TIME
                                    ,MAX(DISK_READS) AS MAX_DISK_READS
                                    ,MAX(BUFFER_GETS) AS MAX_BUFFER_GETS
                                    ,MAX(EXECUTIONS) AS MAX_EXECUTIONS
                                FROM
                                    GV$SQL
                            ) L
                    ) D
                ORDER BY
                    CPU_SECONDS_PROP DESC
                    ,SQL
                    ,DISK_READS_PROP
                    ,BUFFER_GETS_PROP
                    ,EXECUTIONS_PROP
                    ,ELAPSED_SECONDS_PROP
                    ,MODULE
                    ,LAST_ACTIVE_TIME
            ) D
    ) D
WHERE
    ROW# >= 1
AND
    ROW# <= :high
Note I formatted this in SQLcl using the FORMAT command 🙂


10 Comments
hello Jeff, Thank you for posting, but I have a question,
I was looking for the DB monitoring service function and read another article,
but I read a post that said that double-clicking fx-chart goes to the detailed page.
However, as a result of application, no action occurs when double-clicking.
Do you know if this is a problem or a version problem?
Which chart, and which version of SQL Developer?
Amazing upgrade. Does this also show about various execution plans of queries? It will be more interesting if we can figure it out any queries are running on bad plan during particular time frame.
v4.1 has this feature – so you can see all the plans avail for that SQLID
That’s good . Thanks
Can this be used for SE databases w/o hitting the AWR data? I see the query wouldn’t touch it. If you touch those views, you would get dinged for using the diagnostic and tuning pack even tho SE aren’t licensed to use it.
Correct – we don’t hit those views on the main report. You wouldn’t get dinged until you used the drill down report and clicked on either the Tuning or History pages.
This is good news!! Thanks, Jeff!
Very good upgrade.
Is there an easy way to export SQL Elapsed Time History for a specific query? Even better would be to export all of the information in SQL Details to an PDF.
Cheers
Hi Jeff,
Excellent upgrade , now i don’t need to look into OEM for some regular Perf stuff, SQL dev is keep getting better and becoming ‘one stop shop’
it could be good if explain plan could be more descriptive (top sql -> details and in Monitor session -> Explain Plan ) like DBMS_XPLAN style or there is option to view plan in different mode
Thanks