
Yesterday I made my first presentation ever at the annual Hotsos conference. The topic: “All of the Performance Tuning Features in SQL Developer.”
It went pretty well, and I’d like to share those slides now with y’all:
Easier to Read Autotrace Execution Plans
Apparently I said ‘explain plan’ too many times in the session…EXECUTION Plans can be quite big. And the problematic bits generally come down to one or two steps. So, for version 4.1, we’re going to highlight the ‘Hot Spots.’
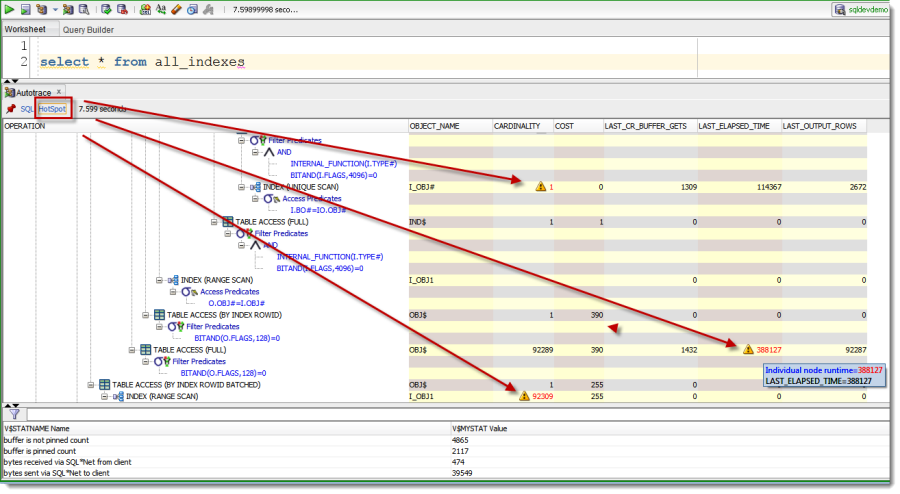
The Hotspots are categorized as having:
- Nodes where cardinality estimation is wrong as witnessed by collected runtime statistics. The node with maximum discrepancy is formally a hotspot. One course of action for performance analyst to follow is adjusting cardinality estimation (e.g. with a hint), thus influencing the optimizer to choose a different plan.
- Nodes where the execution have spent bulk of the time. Formally, we take cumulative run time of a node (v$sql_plan_statistics.last_elapsed_time) and subtract cumulative run time of it’s children.
This feature will be available for you to check out for yourself in our 4.1 Early Adopter 2 update – which will be available soon.
As for making plans themselves easier to read, that’s on our product ‘to do’ list for a future release.


19 Comments
Jeff, any plans to support the display of adaptive plans?
how do you mean? we show you today in the notes if an adaptive plan is in play
Still no disk reads in autotrace output? (how one can tune without knowing of number of disk reads?)
Still no ability to exclude parse overhead from autotrace execution? (autotrace performs a hard-parse, so it includes excessive overhead)
Still no ability to prevent “show plan of sqlid/child_number”? (it breaks v$session.prev_sql_id)
>>Still no disk reads in autotrace output? (how one can tune without knowing of number of disk reads?)
How do you mean? Physical reads are reported. The docs define physical reads as ‘Total number of data blocks read from disk. This number equals the value of “physical reads direct” plus all reads into buffer cache.‘
Collecting instrumentation always adds overhead. It’s costs to measure things. If we’re too expensive, as compared to Autotrace in SQL*Plus w/o giving any additional value or benefit, then that would be a bug that we would need to fix.
No plans to prevent the show plan/sqlid -> way more folks enjoy having that done for them than use your technique, plus you do have a workaround.
> Physical reads are reported
I want per-plan-line physical reads. The data from V$SQL_PLAN_STATISTICS.LAST_DISK_READS.
You do show lots of data from V$SQL_PLAN_STATISTICS already, so I see no reason why you hide other useful columns.
>>Still no ability to exclude parse overhead from autotrace execution?
Let me clarify: suppose I want to trace a query “select * from emps where empno=12”.
I hit autotrace, and it (sqldeveloper) forces a hard parse.
Why? I do not want to know “how much resources does it take Oracle to _parse_ the query”. If I was interested in parsing aspect, I would add comments/hints/etc to ensure the query is reparsed.
If I do it in SQLPlus (or PL/SQL Developer), I can just execute and it will NOT hard-parse the sql.
I see no reason why SQLDeveloper forces a hardparse. I see no option to disable this behaviour either.
> plus you do have a workaround.
Have I?
“Only 5 000 rows currently supported in a script results”.
I do not like profiling “SQLDeveloper’s script output performance” either.
Any plans to make the feature optional?
we can add new columns, easy – just submit an enhancement request
here’s what we do on an autotrace
Your workaround is to select both queries and run both using CTRL+ENTER – i think you’ll miss the query we run to get the SQLID that way.
Tools > Preferences > Database > Worksheet > Max Rows to print in a script >
Go crazy, but you’re on your own if you do…silly things.
>5. run the query
You prepend user-given query it with “/*Auto#1425566327650*/ ” marker, don’t you?
This causes hard-parses.
I mean this thing: https://asktom.oracle.com/pls/asktom/f?p=100:11:0::::P11_QUESTION_ID:2588723819082
> Go crazy, but you’re on your own if you do…silly things.
Can you clarify what is silly in will to collect statistics of a query that returns 100K rows? Query profiling is not a silly activity. If you never profile queries it does not imply profiling is silly.
Silly as in setting script output to max size of 1,000,000 lines and then complaining that SQLDev uses too much memory or slows down, and then most users never even look at the script output past the last few lines.
I see the hard parse, and that’s a bug. It’s been fixed for version 4.1, production. Not sure if it will make our EA2 build or not. Good catch!
Well, is here any feature/workaround to hide output of a particular query while still performing full fetch of it?
theoretically, kind of
use SET TERMOUT OFF, but then you have to run the query via a @ and I think use a spool to catch the output…and not sure we support that syntax in 4.0 but SHOULD when 4.1 is released
LAST_CR_BUFFER_GETS is logical IO. On the other hand, LAST_DISK_READS is volatile. It may also be incorrect, because database might be unaware if a block is cached by OS layer. With solid state disks, memory cache at disc controller the issue becomes even more moot. In short, if you reduced your logical IO, then the query is fine and there is little reason to look onto disk reads.
What did you want to say by this? Have you just suggested me to stop looking at physical reads statistics when I do my day-to-day query tuning?
You can’t “prove” disk reads are irrelevant for query tuning.
Don’t you know a single random read from spinning rust lasts like a 1000s of “logical IO”?
Tom Kyte advocated that very thing, many years ago…
Hi Jeff,
Great improvements! If that won’t convince my wife to switch to SQL Developer, nothing can (she’s a PL/SQL Dev user for 10 years, and traditional tkprof user).
Can’t take my eyes off of DB Instance real-time monitoring. Am hooked!
Thanks!
Horia
Thanks Horia. I’m guessing your wife still won’t switch – most people don’t switch tools voluntarily..unless they get mad.
But if she ever has any questions, send her over our way 🙂
Terminal is something she and her colleagues are using and was missing in SQL Dev, but now SQLcl does that.
So I may subscribe her to your blog 😀
Jeff:
I would also vote for having the notes for explain plan, and on a bigger than SQL Developer note. I want ALL of the tools to display plans the same. Each tool has things it does best. All of the interfaces need to have basically the same capabilities.
Thanks!!!
we do have notes for explain plan…and for plans looking the same throughout all the tools/places out there – I hear you, but that’s a pretty big goal, and I’m not even sure it would make sense. How best to see a plan in one interface might not work for another…but a common standard doesn’t sound like a bad idea to me.